
Proportional Relationships
Presentation
•
Mathematics
•
7th Grade
•
Medium
•
CCSS
7.RP.A.2D, 7.RP.A.2B, 8.EE.B.5
+7
Standards-aligned

Katrina Oliver
Used 6K+ times
FREE Resource
3 Slides • 11 Questions
1
Proportional Relationships

2
Characteristics of Proportional Graphs.
They are in the shape of a straight line.
They start or cross at the point of origin.

3
Multiple Choice

Which graph is non-proportional?
4
Multiple Choice

Does this graph represent a proportional relationship?
5
Multiple Choice
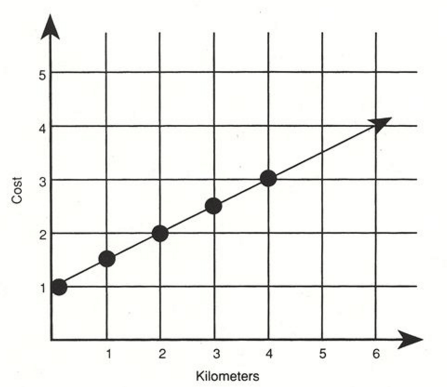
Is the graph proportional or non proportional?
6
Multiple Choice
7
8
Multiple Choice
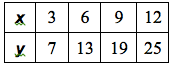
Does the table represent a proportional relationship?
9
Multiple Choice

What is the constant of proportionality?
10
Multiple Choice
11
Multiple Choice

Write an equation for this relationship.
12
Multiple Choice

Write the equation for the table given.
13
Multiple Choice

Write the equation for the table given
14
Multiple Choice

What is the constant of proportionality?
Proportional Relationships
Show answer
Auto Play
Slide 1 / 14
SLIDE
