
Proportional Relationships
Presentation
•
Mathematics
•
7th Grade
•
Practice Problem
•
Easy
+1
Standards-aligned

undefined Ruhmel
Used 21+ times
FREE Resource
7 Slides • 19 Questions
1
Proportional Relationships Practice

2
Poll
3
4

5
Poll
6
7
8
9
Multiple Choice

Find the ratio of the cost to the pounds for each of the three columns. This is the constant of proportionality.
10
Multiple Choice

Find the ratio of the votes for Victor to the number of votes for Faye for all columns. This is the constant of proportionality.
11
Multiple Choice

Find the ratio of the cost of the chicken to the pieces of the chicken for all columns. This is the constant of proportionality.
12
Multiple Choice
13
14
Multiple Choice

In this proportional table, Dan charges $15 per hour for walking dogs. What is the missing number in the table?
15
Multiple Choice
16
Multiple Choice
17
Multiple Choice
18
Multiple Choice

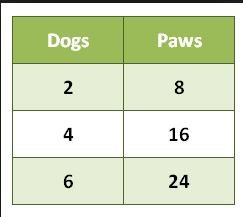
Is this table proportional or non-proportional?
19
Multiple Choice

20
Multiple Choice

21
Multiple Choice
22
Multiple Choice

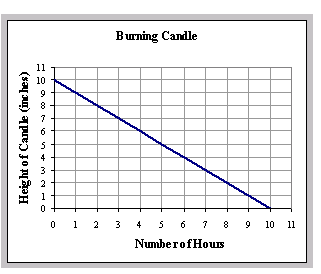
Proportional or Non-Proportional?
23
Multiple Choice

24
Multiple Choice

25
Multiple Choice
26
Multiple Choice
Proportional Relationships Practice
Show answer
Auto Play
Slide 1 / 26
SLIDE
