
9.1-9.6
Presentation
•
Mathematics
•
12th Grade
•
Medium
+3
Standards-aligned

Charlotte Turrubiartes
Used 3+ times
FREE Resource
2 Slides • 16 Questions
1
9.1-9.6

2
Multiple Choice
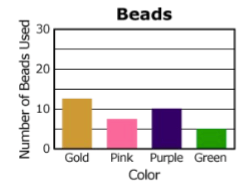
The graph shows the number of colored beads used to make a necklace. How many purple and green beads were used in all?
3
Multiple Choice

How many more students like soccer than hockey?
4
Multiple Choice

How many students scored more than 80%?
5
Multiple Choice
What is the mean score?
6
Multiple Choice
What is the standard deviation?
7
Multiple Choice
What is the median?
8
Fill in the Blanks

Type answer...
9
Fill in the Blanks
Type answer...
10
Fill in the Blanks
Type answer...
11
Fill in the Blanks
Type answer...
12
Fill in the Blanks
Type answer...
13
Fill in the Blanks
Type answer...
14
Multiple Select
Find the outlier(s) in the set of data
10, 59, 67, 72, 73, 76, 88, 92, 106, 111, 115, 160
15

16
Multiple Choice

17
Multiple Choice
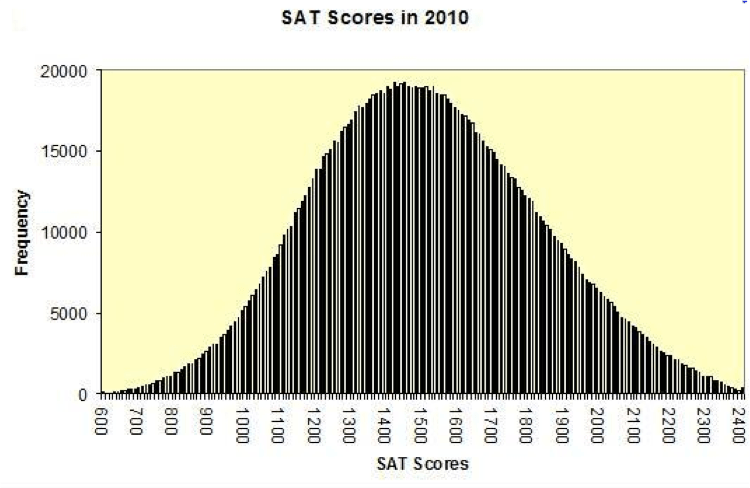
What is the shape of the distribution?
18
Multiple Choice

What is the shape of the distribution?
9.1-9.6
Show answer
Auto Play
Slide 1 / 18
SLIDE
