Search Header Logo
9.1-9.9

9.1-9.9

Assessment

Presentation

Mathematics

12th Grade

Medium

CCSS
HSS.ID.A.4, HSS.ID.A.3, 6.SP.B.5A

Standards-aligned

Created by

Charlotte Turrubiartes

Used 3+ times

FREE Resource

5 Slides • 21 Questions

1

9.1-9.9

Slide image

2

Fill in the Blank

Question image

How many festivals were there according to the histogram?

3

Multiple Choice

Question image

Which group has the higher median?

1

The Cruisers

2

The Car Hops

3

They are the same

4

Multiple Choice

Question image

Which group has the larger IQR?

1

The Cruisers

2

The Car Hops

3

They are the same

5

Multiple Choice

Question image

Which group has the larger range?

1

The Cruisers

2

The Car Hops

3

They are the same

6

Multiple Choice

Question image

Given the following distributions, which has the highest median?

1

Red (top)

2

Purple (middle)

3

Black (bottom)

7

Multiple Choice

Question image

Given the following distributions, which has the smallest IQR?

1

Red (top)

2

Purple (middle)

3

Black (bottom)

8

Multiple Select

Which option below is not an outlier if Q1 = 53 and Q3=61?

1

72

2

40

3

80

4

73.5

9

Slide image

10

Multiple Choice

Question image

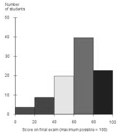
Describe the data distribution shape of the graph.

1

Skewed right

2

Skewed left

3

Uniform

4

Symmetrical

11

Multiple Choice

Question image

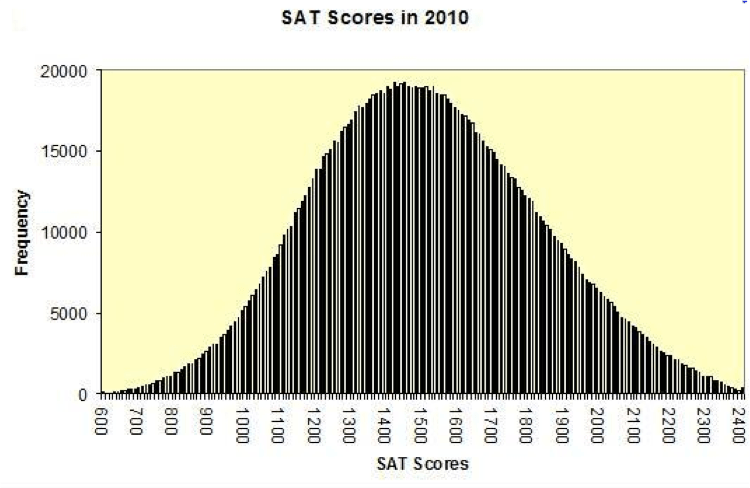
What is the shape of the distribution?

1

Skewed Left

2

Skewed Right

3

Symmetric or bell

4

uniform

12

Multiple Choice

Question image

Type of Data arrangement

1

Symmetrical

2

uniform

3

Skewed Right

4

Skewed Left

13

Multiple Choice

Question image

What is the percentage of data that falls within one standard deviation of the mean?

1

67%

2

65%

3

72%

4

68%

14

Multiple Choice

Question image

What is the percentage of data that falls within two standard deviations of the mean?

1

68%

2

99.7%

3

95%

4

98%

15

Multiple Choice

Question image

What is the percentage of data that falls within three standard deviations of the mean?

1

99.7%

2

98.7%

3

95%

4

100%

16

Multiple Choice

Question image

This data is normally distributed. What percent of the data is in the shaded region?

1

5%

2

95%

3

2.5%

4

50%

17

Multiple Choice

Question image

This data is normally distributed. What percentage of the data is in the shaded region?

1

68%

2

34%

3

17%

4

50%

18

Fill in the Blank

Students take a math test.


Student A got a 76 with a class mean of 70 and a standard deviation of 3.


Student B got a 105 with a class mean of 97 and a standard deviation of 5.


Find the z-score for Student A.

19

Fill in the Blank

Students take a math test.


Student A got a 76 with a class mean of 70 and a standard deviation of 3.


Student B got a 105 with a class mean of 97 and a standard deviation of 5.


Find the z-score for Student B.

20

Multiple Choice

Students take a math test.


Student A got a 76 with a class mean of 70 and a standard deviation of 3.


Student B got a 105 with a class mean of 97 and a standard deviation of 5.


Which student did better relative to their class?

1

Student A

2

Student B

3

They did the same

21

Multiple Choice

The shelf life of a particular dairy product is normally distributed with a mean of 12 days and a standard deviation of 3 days.


About what percent of the products last 6 days or less?

1

68%

2

97.72%

3

5%

4

2.28%

22

Slide image

23

Fill in the Blank

The shelf life of a particular dairy product is normally distributed with a mean of 12 days and a standard deviation of 3 days.


What percent of the products last between 7 and 10 days? (do not put % sign)

24

Slide image

25

Fill in the Blank

The shelf life of a particular dairy product is normally distributed with a mean of 12 days and a standard deviation of 3 days.


What percent of the products last more than 16 days?

26

Slide image

9.1-9.9

Slide image

Show answer

Auto Play

Slide 1 / 26

SLIDE