
y = mx
Presentation
•
Mathematics
•
8th Grade
•
Medium
+1
Standards-aligned

Kenneth Weiss
Used 21+ times
FREE Resource
6 Slides • 24 Questions
1
y = mx
Proportional Relationship
Direct variation

2
Slope Intro Review

3
Multiple Choice

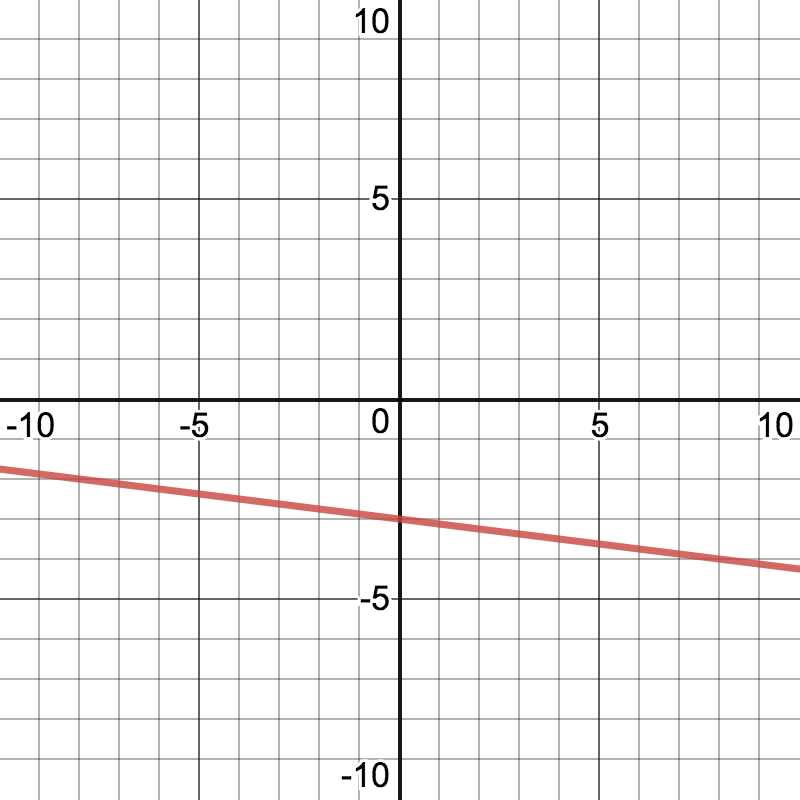
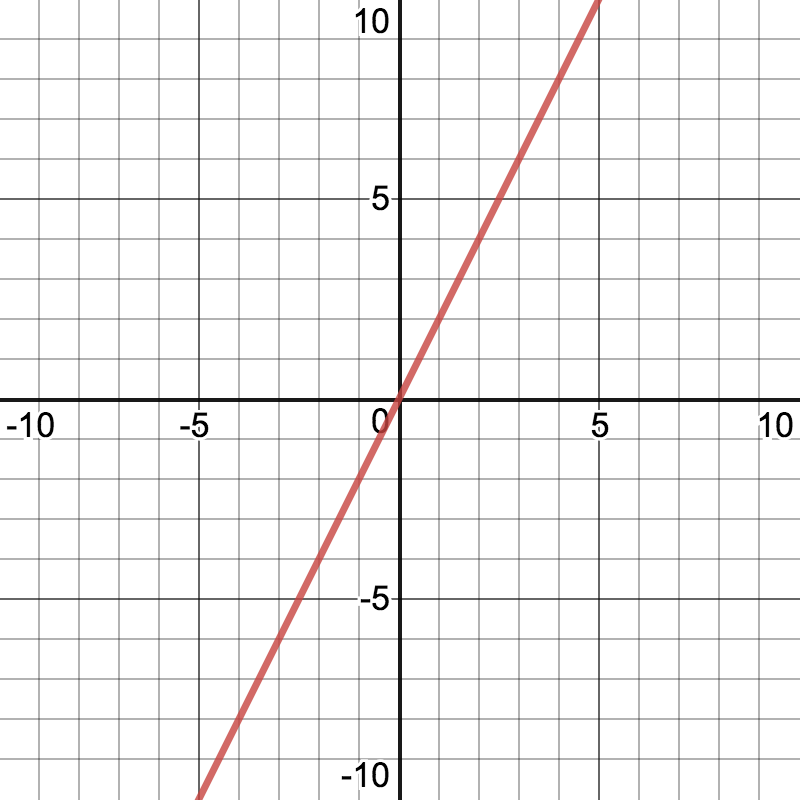
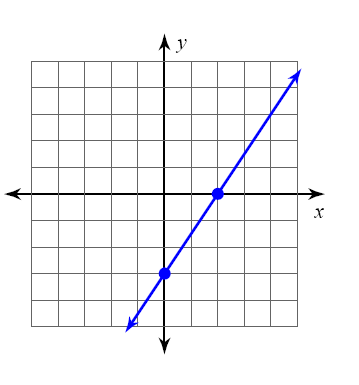
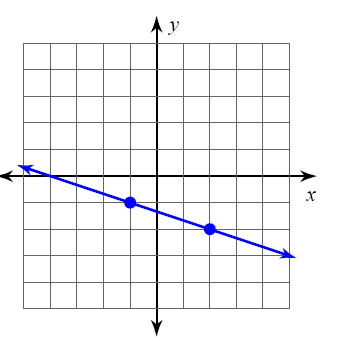
Categorize the slope of the line
4
Multiple Choice
Categorize the slope of the line
5
Multiple Choice
Categorize the slope of the line
6
Fill in the Blanks
Type answer...
7
Fill in the Blanks
Type answer...
8
Multiple Choice
What is the slope of the line?
9
Fill in the Blanks
Type answer...
10
Fill in the Blanks
Type answer...
11
Multiple Choice
What is the slope of the line?
12
Direct Variation
y = mx
If you can multiply the x values by the same constant and get the y value there is a direct variation. (This is also proportional)

13
Fill in the Blanks

Type answer...
14
Fill in the Blanks
Type answer...
15
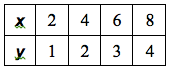
Direct Variation Table
y directly varies in relation to x
y = mx
where m is a constant we multiply by x to get y

16
Multiple Choice

Proportional or Non-Proportional?
17
Multiple Choice
18
Multiple Choice
19
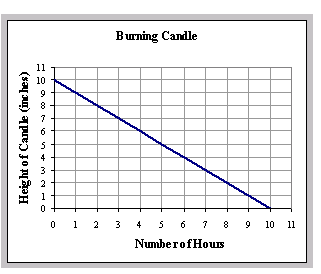
Direct Variation
Graph
When data has a direct variation you get a straight line (linear) that goes through the origin.

20
Multiple Choice

The graph shown is:
21
Multiple Choice
Is the graph proportional or nonproportional?
22
Multiple Choice

Is the graph proportional or non proportional?
23
Equation
In the table to the right if we take y divided by x we get 5.
therefore, m = 5
Our equation is
y = mx
y = 5x

24
Multiple Choice

What is the slope of the table?
25
Multiple Choice

What is the slope of the table?
26
Multiple Choice

What equation is represented by the table?
27
Multiple Choice

What equation is represented by the table?
28
Multiple Choice

29
Multiple Choice

30
Fill in the Blanks
y = mx
Proportional Relationship
Direct variation
Show answer
Auto Play
Slide 1 / 30
SLIDE
