Search Header Logo
Scatterplot and line of fit review

Scatterplot and line of fit review

Assessment

Presentation

Mathematics

8th Grade

Practice Problem

Medium

CCSS
HSS.ID.B.5, 8.EE.B.5, 8.F.A.3

+6

Standards-aligned

Created by

Karyn Muir

Used 62+ times

FREE Resource

11 Slides • 18 Questions

1

Scatterplot and line of fit review

Slide image

2

Types of correlation

Slide image

3

Outliers, gaps and clusters

Slide image

4

Multiple Choice

Question image

What type of correlation does this scatter plot show?

1

positive

2

negative

3

no correlation

4

nonlinear association

5

Multiple Choice

Question image

What type of association does this graph have?

1

positive

2

negative

3

none

4

all of the above

6

Multiple Choice

Question image

What is the type of correlation?

1

Negative

2

no correlation

3

positive

7

Multiple Choice

Question image

Does this data show a “linear” or “nonlinear” association?

1

linear

2

nonlinear

8

Multiple Choice

Which graph shows “clustering?”

1
2

9

Multiple Choice

Question image

Which of these points appears to be an “Outlier?”

1

A

2

B

3

C

4

D

10

Multiple Choice

What type of correlation would you likely see with:


The amount of time spent working compared to the amount of money earned

1

positive correlation

2

negative correlation

3

no correlation

11

Multiple Choice

Question image

About how many male math teachers were there in 2006?

1

15

2

30

3

35

4

45

12

Lines of fit

The best line of fit goes through the center of the data, following the trend of the scatterplot

Slide image

13

Multiple Choice

Question image

Which graph shows a line of best fit for the scatter plot?

1

Graph A

2

Graph B

3

Graph C

4

Graph D

14

Multiple Choice

Question image

Which of the following lines represents the line of best fit for the scatter plot?

1

A

2

B

3

C

4

D

15

Multiple Choice

Question image

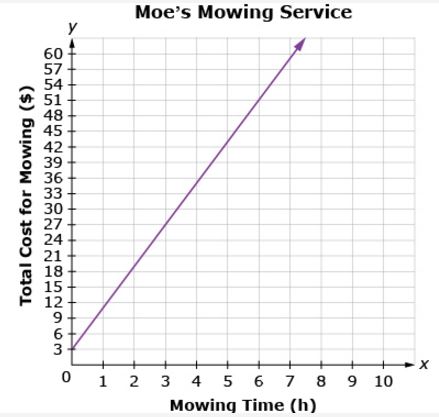
What is the general trend of this line graph?

1

The more you mow, the less money you make.

2

You make the same amount of money regardless of how long you mow.

3

The more you mow, the more money you make.

4

Mowing is dangerous.

16

Multiple Choice

What is a line of best fit used for?

1

To make predictions

2

To make the graph look pretty

3

To connect the points

4

To make it look like you know what you are doing

17

Estimate the line

 m=y2 y2x2x1m=\frac{y_{2\ }-y_2}{x_2-x_1}  

 m=8528=36=12m=\frac{8-5}{2-8}=\frac{3}{-6}=-\frac{1}{2}  

Solve for b using a point, or use graph to find b.

 y=12x+9y=-\frac{1}{2}x+9  

Slide image

18

Multiple Choice

Suppose a LINE OF BEST FIT passes through the points (4, 8) and (6, 2). The SLOPE of this line is . . .?

1

-3

2

-6

3

4

4

2

19

Points: (4,8) and (6,2)

 m=y2y1x2x1=8246=62=3m=\frac{y_2-y_1}{x_2-x_1}=\frac{8-2}{4-6}=\frac{6}{-2}=-3  

20

Multiple Choice

Question image

Which of the following could be a possible line of best fit for the data?

1

y = -5/2x + 20

2

y = -x + 19

3

y = x + 20

4

y = 2/3x + 15

21

Choices:

A: y = -5/2x + 20

B: y = -x + 19

C: y = x + 20

D: y = 2/3x + 15 


Eliminate C and D because of their slopes


Test A and B to see which looks closer to the data points

Slide image

22

Multiple Choice

Question image

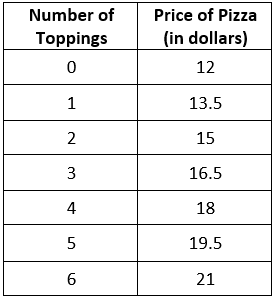
A restaurant sells pizza for the prices in the data table. Calculate the linear regression equation of the data.

1

y = 1.5x + 12

2

y = 12x + 1.5

3

y = 0.67x - 8

4

y = -8x + 0.67

23

Slide image

y = 1.5x + 12

24

Multiple Choice

Question image

What is the line of best fit?

1

f(x)= 5x+1.82

2

cannot be determined

3

f(x)= 1.82x + 5.02

4

f(x)= 1.1x + 4.2

25

Slide image

y=1.82x+5.02

26

Multiple Choice

What does an r value of r = 0.9997 imply?

1

Strong positive correlation

2

Weak positive correlation

3

Strong negative correlation

4

Weak negative correlation

27

Multiple Choice

Question image

The linear regression equation is y = 61.93x - 1.79. Use the equation to predict how far this person will travel after 10 hours of driving.

1

10 miles

2

617.5 miles

3

0.19 miles

4

500 miles

28

y=61.93x - 1.79

Plug in 10 for x


y=61.93(10) - 1.79


= 619.3 - 1.79


= 617.5

29

Any last minute questions?

Scatterplot and line of fit review

Slide image

Show answer

Auto Play

Slide 1 / 29

SLIDE