Search Header Logo
Graphs and measures of central tendency

Graphs and measures of central tendency

Assessment

Presentation

Mathematics, Other

7th - 12th Grade

Medium

CCSS
6.SP.B.5, 6.SP.A.3, 6.SP.A.1

+13

Standards-aligned

Created by

Jesus Molina

Used 8+ times

FREE Resource

3 Slides • 19 Questions

1

Graphs and measures of central tendency

media

2

3

Multiple Choice

Question image
Find the Median
1
98
2
93
3
78
4
85

4

Multiple Choice

Question image
What is the minimum in this data set?
1
0
2
4
3
9
4
40

5

Multiple Choice

Question image
Students were surveyed about their favorite sports to play in phys.ed. The results are represented in this circle graph. If 48 students were surveyed, how many chose soccer?
1
10
2
12
3
15
4
14

6

Multiple Choice

Question image

Which bar graph is the same as the data in the circle graph if 20 people were surveyed?

1
2
3
4

7

Multiple Choice

Question image
How many cars were sold on Saturday and Sunday?
1
5
2
3
3
8
4
10

8

Multiple Choice

Question image

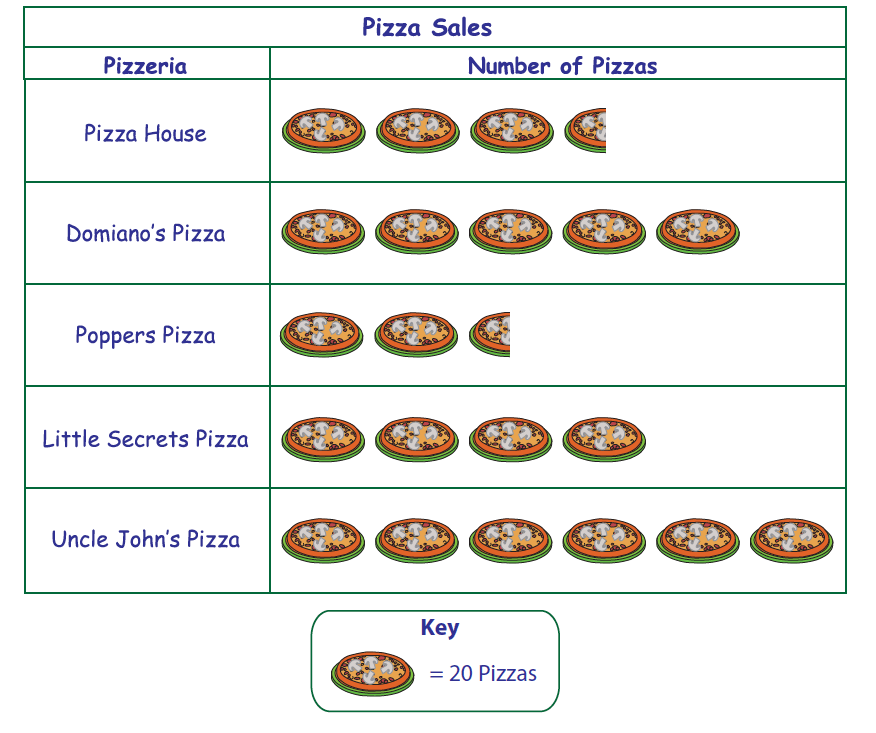
How many pizzas were sold by Poppers Pizza?

1

50

2

3

3

30

4

2 and a half

9

Multiple Choice

Question image
How many people like either mushroom or pepperoni the best?
1
1
2
20
3
50
4
100

10

11

Multiple Choice

Question image
The table lists five counties with the largest area in Texas. Find the mean.
1
23,197
2
4,639.4
3
4,571

12

Multiple Choice

Question image
Explain why this graph may be misleading?
1
the x-axis does not have equal intervals
2
San Fransisco is not a real city
3
you cannot have percents in a line graph
4
the y-axis does not have equal intervals

13

Multiple Choice

Question image
Find the Mean. 
1
53.5
2
48
3
49
4
48.6

14

Multiple Choice

Question image
The graph shows the results of a survey to determine student's favorite pets. Why is this graph misleading?
1
The slices are the wrong color
2
The slices are not the correct size
3
The percents do not add up to 100
4
Not misleading

15

Multiple Choice

What is the definition of the mean?
1
The average
2
The middle number
3
The difference between the highest and lowest numbers
4
The number that occurs the most

16

Multiple Choice

Question image

What type of statistical distribution is represented?

1

normal

2

not normal

17

Multiple Choice

Question image

What was the average wait time in May?

1

50

2

51

3

52

4

53

18

Multiple Choice

Question image

How many times did the dice land on a number larger than 3 

1

2

2

5

3

9

4

10

19

Multiple Choice

Question image

What is the range of the data set? 

1

2

3

4

20

Multiple Choice

Question image
What is the mode of the scores?
1
24
2
14
3
34
4
30

21

Multiple Choice

Find the mean of these numbers:
5, 11, 2, 12, 4, 2
1
4.1
2
6
3
4.5
4
4

22

Multiple Choice

If you score 76, 85, 97, and 83 on your math tests, what would your median score be? 
1
84
2
90
3
85
4
88

Graphs and measures of central tendency

media

Show answer

Auto Play

Slide 1 / 22

SLIDE