
Piecewise Functions - w/video links
Presentation
•
Mathematics
•
9th - 12th Grade
•
Medium
+1
Standards-aligned

Kristal Shaikh
Used 7+ times
FREE Resource
18 Slides • 20 Questions
1
Piecewise Functions - w/Video links
Get ready to take some notes as you work!

2
3
4
Multiple Choice

Graph
*hint-use calculator to look at graph or table of each piece of the piecewise function
5
Multiple Choice

Graph
*hint-use calculator to look at graph or table of each piece of the piecewise function
6
Multiple Choice

Graph
*hint-use calculator to look at graph or table of each piece of the piecewise function
7
Multiple Choice

Graph
*hint-use calculator to look at graph or table of each piece of the piecewise function
8
Multiple Choice

Graph
*hint-use calculator to look at graph or table of each piece of the piecewise function
9
Multiple Choice

Graph
*hint-use calculator to look at graph or table of each piece of the piecewise function
10
Discontinuous
The function defined for x = 2 is not the same as the function defined at x<2 or x>2

11
Continuous
The function at x< 0 has the same output value as the function at x > 0

12
Domain
The domain of the piecewise function is the union of all of the x-values of the different intervals
If each interval of each unique function is continous with the interval that precedes it (no gaps), then the domain is defined by the interval from the lowest value of x to the greatest value of x
If the intervals are not continuous, then the domain is the union of each unique interval.

13
Domain
To find the domain, look at the defined intervals
Check to see if the x values are continuous (the beginning value of one function picks up where the ending of the previous function left off)
In the example, x = -1 is not included in the right-most function, but it is included in the left-most function, so the domain is continuous and includes the interval between the smallest value of x ( - ) to the largest value of x (+ )
This makes the domain the set of all real numbers

14
Domain
In this image, the domain is not defined when 1 < x < 2 (there is no graph for those x values) so it is discontinuous. It must be named by the union of each separate interval
{ -5 x 1} {2 x 5}

15
Domain
In this image, the domain is defined for all x values from - to so it is continuous.
Domain is All real Numbers or - x

16
Range
The range of the piecewise function is the union of the ranges (y-values) of each individual function

17
Range
To find the range, look at the lowest function value of all the "pieces" of the function (draw a dotted line from the lowest value of the function to the y-axis). That is the lowest boundary of your range.
Repeat for the greatest value of y. Draw a line from the graph to the y-axis. This is the upper boundary for range.
If the output (includes all intervals) has defined values for all the points between the upper boundary and lower boundary, then the function is continuous.

18
Range
If the function values are not defined at all points between the upper boundary and lower boundary, then it is discontinous and must be named as the union of the different intervals of f(x)
In this example, O look at my lowest value of any f(x), and that is 1/5. The greatest value is up to, but not including 5/2
Even though there are gaps between the individual intervals, if you were to shade in the intervals on the y-axis, you would see that they overlap, making them continuous
Even though this function looks like it would not be, the range is (-5/2, 1/5] since f(x) is defined at all the points in between

19
Multiple Choice

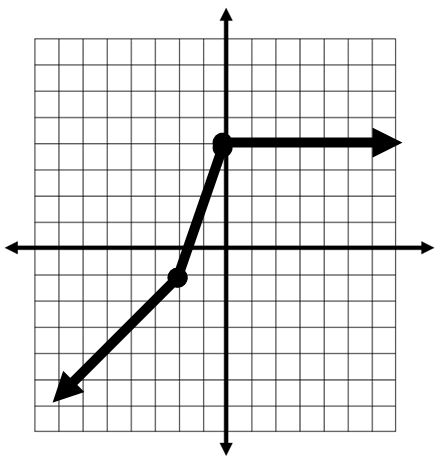
Where is this piecewise function discontinuous?
20
Multiple Choice

21
Multiple Choice

What is the domain of the graph?
22
Multiple Choice

23
Multiple Choice

What are the domain restrictions for the green piece of this function?
24
Multiple Choice

Is this piecewise function continuous?
25
Multiple Choice
What is the RANGE of the function?
26
Evaluating an Input to a Piecewise Function
Look to see where the input value falls into the defined intervals
Evaluate the input using the corresponding function rule for that interval

27
Evaluating an input
Since 5 is > 3, you would use the function rule f(x) = 1/2 x + 1 to evaluate the function at x = 5
Since -4 < 3, you would use the function rule f(x) = 2 |x+4| -2 to evalute the function at x = -4
Since 3 > 3, you would use the function rule f(x) = 1/2 x + 1

28
29
Multiple Choice

What is g(7) if:
30
Multiple Choice

Find f(3)
31
Fill in the Blank

Find f(0)
32
Multiple Choice
Find f(3)
33
34
35
Multiple Choice
36
Multiple Choice

Which of the piecewise functions matches this graph?
37
Multiple Choice

When , what equation is shown in the graph?
38
Piecewise Functions - w/Video links
Get ready to take some notes as you work!
Show answer
Auto Play
Slide 1 / 38
SLIDE
Similar Resources on Wayground

31 questions
7.1 Biodiversity Lesson 1
Lesson
•
9th - 12th Grade
33 questions
Arc Length and Sector Area
Lesson
•
9th - 12th Grade
35 questions
Multiplication Rule for Probability
Lesson
•
9th - 12th Grade
33 questions
Spanish Weather
Lesson
•
9th - 12th Grade
35 questions
4-5 Tan, Cot, Csc, Sec Graphs Lesson
Lesson
•
9th - 12th Grade
31 questions
Dilations and Similarity
Lesson
•
9th - 12th Grade
32 questions
Introduction to Reflexive Verbs
Lesson
•
9th - 12th Grade
32 questions
Lab Equipment
Lesson
•
9th - 12th Grade
Popular Resources on Wayground
15 questions
Fractions on a Number Line
Quiz
•
3rd Grade
20 questions
Equivalent Fractions
Quiz
•
3rd Grade
25 questions
Multiplication Facts
Quiz
•
5th Grade
29 questions
Alg. 1 Section 5.1 Coordinate Plane
Quiz
•
9th Grade
22 questions
fractions
Quiz
•
3rd Grade
11 questions
FOREST Effective communication
Lesson
•
KG
20 questions
Main Idea and Details
Quiz
•
5th Grade
20 questions
Context Clues
Quiz
•
6th Grade
Discover more resources for Mathematics
29 questions
Alg. 1 Section 5.1 Coordinate Plane
Quiz
•
9th Grade
20 questions
Graphing Inequalities on a Number Line
Quiz
•
6th - 9th Grade
20 questions
Box and Whisker Plots
Quiz
•
9th Grade
18 questions
Exponential Growth and Decay
Quiz
•
9th Grade
20 questions
Function or Not a Function
Quiz
•
8th - 9th Grade
20 questions
SSS/SAS
Quiz
•
9th - 12th Grade
14 questions
Making Inferences From Samples
Quiz
•
7th - 12th Grade
23 questions
CCG - CH8 Polygon angles and area Review
Quiz
•
9th - 12th Grade