
Graphing Inequalities
Presentation
•
Mathematics
•
6th - 7th Grade
•
Medium
Standards-aligned

Courtney Verdree
Used 224+ times
FREE Resource
17 Slides • 11 Questions
1
Graphing Inequalities

2

3

4

5

6

7

8

9

10

11
Multiple Choice

How would the graph of x > 12 look?
12

13

14
Multiple Choice

How would the graph of s < 12 look?
15

16

17
Multiple Choice

How would the graph of the m 2 look?
18

19

20
Multiple Choice
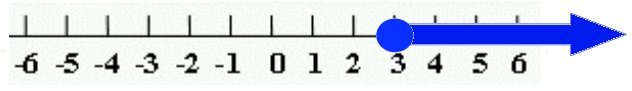
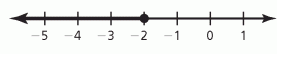
What inequality does the number line graph represent?
21
Multiple Choice
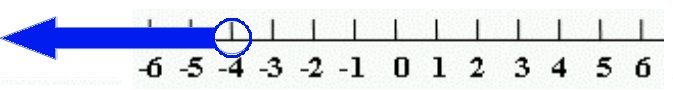
What inequality does the number line graph represent?
22
Multiple Choice
Match the graph with its inequality.
23
Multiple Choice

What inequality does the number line graph represent?
24
Multiple Choice
25
Multiple Choice

Match the graph with its inequality.
26
Multiple Choice
27
Multiple Choice

What inequality does the number line graph represent?
28

Graphing Inequalities
Show answer
Auto Play
Slide 1 / 28
SLIDE
