
Math
Presentation
•
Mathematics
•
1st Grade
•
Medium

elsie bacus
Used 12+ times
FREE Resource
11 Slides • 10 Questions
1
Math: Chapter 10
Represent Data
Lesson 1 :Read Picture Graphs
Lesson 2: Hands On: Make Picture Graphs
Lesson Objectives:
1. Analyze and compare data shown in a picture graph where each symbol represents one.
2. Make a picture graph where each symbol represents one and interpret the information.

2
In this lesson you will learn:
reading a picture graph
making a picture graph

3
Lesson 1
Read Picture Graph

4

5
6
Lesson 2
Hands-On: Make a Picture Graph

7

8
9

10
Multiple Choice

How many animals in the farm altogether?
11
Multiple Choice

There are _______ fewer cats than dogs
12
Multiple Choice

How many students like to play soccer ball?
13
Multiple Choice

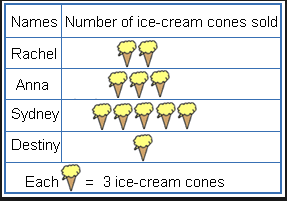
There are ______ oranges at Peter's home.
14
Multiple Choice

Who has the greatest number of marbles
15
Multiple Choice
16
Multiple Choice

Which fruit was the most favorite?
17
Multiple Choice

How many more people like the color purple than blue?
18
Multiple Choice
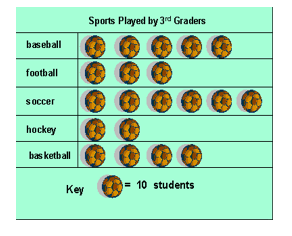
How many students liked basketball?
19
Multiple Choice

20

21

Math: Chapter 10
Represent Data
Lesson 1 :Read Picture Graphs
Lesson 2: Hands On: Make Picture Graphs
Lesson Objectives:
1. Analyze and compare data shown in a picture graph where each symbol represents one.
2. Make a picture graph where each symbol represents one and interpret the information.
Show answer
Auto Play
Slide 1 / 21
SLIDE
