
Math: Chapter 10: Lessons 3 & 4
Presentation
•
Mathematics
•
1st Grade
•
Medium

elsie bacus
Used 4+ times
FREE Resource
10 Slides • 10 Questions
1
Math: Chapter 10
Lesson 3: Read Bar Graph
Lesson 4: Hands-On: Make Bar Graph
Lesson Objectives:
1. Analyze and compare data shown in a bar graph.
2.Make a bar graph and interpret the information.

2
In these lessons you will learn how to read, and make a bar graph.

3
Lesson 3
Read Bar Graph
1. We can read a bar graph to find the number that it shows.
2. In a bar graph, each bar shows information. There is a number line scale on the side.
3. We can compare the length of each bar matches with the scale on the side.

4

5
6
Lesson 4
The next lesson is about how to make a bar graph.
1. We can make a bar graph to help us compare information.
2. We need a title to that tells everyone what the bar graph is about.
3. We need bar labels that tells the name for each bar.

7

8
9

10

11
Multiple Choice

How many children in all chose car and dump truck?
12
Multiple Choice

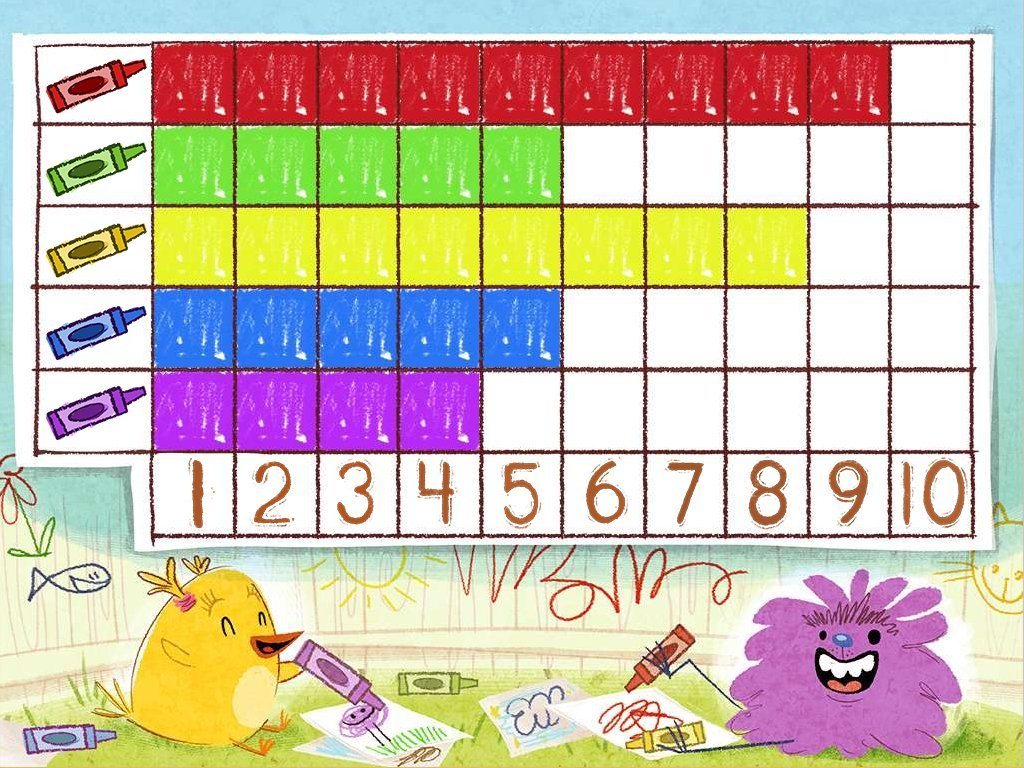
Which art tool did the fewest children choose?
13
Multiple Choice
How many children chose crayon?
14
Multiple Choice
How many children chose paintbrush?
15
Multiple Choice
What is a possible title for this bar graph?
16
Multiple Choice

17
Multiple Choice

How many horses does Nate have on his farm?
18
Multiple Choice
19
Multiple Choice

20
Multiple Choice

CHALLENGE: How many people picked basketball or soccer as their favorite sport?
Math: Chapter 10
Lesson 3: Read Bar Graph
Lesson 4: Hands-On: Make Bar Graph
Lesson Objectives:
1. Analyze and compare data shown in a bar graph.
2.Make a bar graph and interpret the information.
Show answer
Auto Play
Slide 1 / 20
SLIDE
