
Scatter plots 5.9B
Presentation
•
Mathematics
•
5th Grade
•
Medium
+5
Standards-aligned

Stefany Ramirez
Used 208+ times
FREE Resource
9 Slides • 9 Questions
1

2

3

4
Multiple Choice

What represents the x axis?
¿Qué representa el eje x?
5
Multiple Choice

What represents the y axis?
¿Qué representa el eje y?
6
Multiple Choice

The following scatter plot shows Pam's training as she prepares to run a 6 mile race at the end of the month. Which of the following would be a reasonable approximation for the length of time it would take for her to run 6 miles? El siguiente diagrama de dispersión muestra el entrenamiento de Pam mientras se prepara para correr una carrera de 6 millas a fin de mes. ¿Cuál de las siguientes sería una aproximación razonable del tiempo que le tomaría correr 6 millas?
7
Multiple Choice
What are the different times that she ran 2 miles ?
¿Cuáles son las diferentes veces que ella corrió 2 millas?
8
Multiple Choice
What are the different times that she ran 4 miles ?
¿Cuáles son las diferentes veces que ella corrió 4 millas?
9

10

11
Multiple Choice

Based on the graph, if Joe earned $400, about how many hours did he work?
Según la gráfica, si Joe ganó $400, ¿cuántas horas trabajó aproximadamente?
12

13
Multiple Choice

14

15

16

17
Multiple Choice

What type of correlation is shown in this plot?
¿Qué tipo de correlación se muestra en este gráfico?
18
Multiple Choice
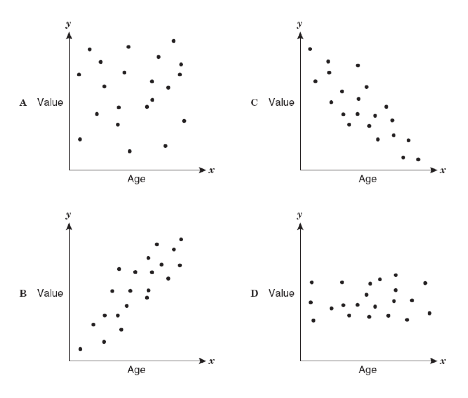
As the age of the car increases, its value decreases. Which scatterplot represents this relationship?
A medida que aumenta la edad del automóvil, su valor disminuye. ¿Qué diagrama de dispersión representa esta relación?
Show answer
Auto Play
Slide 1 / 18
SLIDE
