Search Header Logo
4/15 Quantitative Algebra

4/15 Quantitative Algebra

Assessment

Presentation

Mathematics

12th Grade

Hard

CCSS
6.SP.B.4, 6.SP.B.5C, HSS.ID.A.1

Standards-aligned

Created by

Gabrielle Acosta

Used 1+ times

FREE Resource

5 Slides • 11 Questions

1

4/15 Quantitative Algebra

Slide image

2

Open Ended

Question image

3

Slide image

4

Slide image

5

Slide image

6

Multiple Choice

Question image
Which box and whisker plot has the smallest lower quartile?
1
Top plot
2
Bottom plot

7

Multiple Choice

Question image
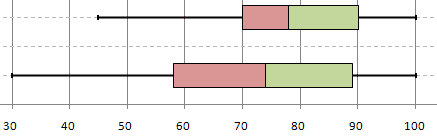
Which box and whisker plot has the highest median?
1
Top plot
2
Bottom plot

8

Multiple Choice

Question image

Which has a Median of 1?

1

Zach

2

Steven

3

They both have a median on 1

9

Multiple Choice

Question image

1

A.

2

B.

3

C.

4

D.

10

Multiple Choice

Question image

What is the difference between the medians?

1

16

2

12

3

8

4

4

11

Multiple Choice

Question image

Which is NOT ture?

1

The spreads of the low temperatures for Reybold and Picktown are not the same

2

Neither box plot is symmetrical

3

The lower quartile temperatures for Reybold and Picktown are different

4

The minimum for Picktown is approximately 5 degrees lower than the minimum for Reybold

12

Multiple Choice

Question image

What data value is the upper quartile (Q3)?

1

64

2

62

3

66

4

58

13

Multiple Choice

Question image
What value is the lower quartile (Q1)?
1
66
2
58
3
60
4
64

14

Multiple Choice

Question image
What is the median?
1
62
2
58
3
66
4
60

15

Multiple Choice

Question image
1
2
3

16

Slide image

4/15 Quantitative Algebra

Slide image

Show answer

Auto Play

Slide 1 / 16

SLIDE