Scatterplot and Correlation Review (Topic 4 Quiz Prep)
Presentation
•
Mathematics
•
8th Grade
•
Easy
+7
Standards-aligned

Cheryle Earl
Used 15+ times
FREE Resource
1 Slide • 19 Questions
1
Scatterplot and Correlation Review (Topic 4 Quiz Prep)
2
Poll
How confident are you for your quiz?
SUPER CONFIDENT - This is easy!
OKAY - I think I get it
NOT GREAT - I know some but need more practice
TERRIBLE - I need to meet
3
Multiple Choice
4
Multiple Choice
What type of correlation does the following scatterplot show?
Positive
Negative
Nonlinear
5
Multiple Choice
6
Multiple Choice
7
Multiple Choice
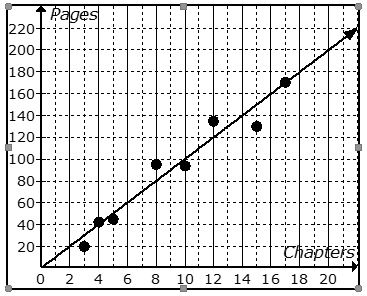
The scatter plot shows the relationship between the number of chapters and the total number of pages for several books. Use the trend line to predict how many chapters would be in a book with 220 pages.
22 chapters
20 chapters
18 chapters
26 chapters
8
Multiple Choice
What is a line of best fit used for?
To make predictions
To make the graph look pretty
To connect the points
To make it look like you know what you are doing
9
Multiple Choice
10
Multiple Choice
What does the x variable represent?
The number of laps
The amount of time in hours
The amount of time in minutes
How long it takes to go 0 laps
11
Multiple Choice
What is the correlation between length of running start and distance of jump?
the further you run the further you jump
the further you run the less distance of your jump
12
Multiple Choice
13
Multiple Choice
What type of correlation does this graph show?
Positive correlation
Negative correlation
No correlation
Constant correlation
14
Multiple Choice
What is the strength of this scatter plot?
strong linear
weak-moderate linear
15
Multiple Choice
how would you describe this association?
positive linear strong
positive linear weak
positive linear moderate
no association
16
Multiple Choice
How would you describe the association?
negative linear strong with outlier
negative non linear weak
positive linear moderate with outlier
outlier
17
Multiple Choice
18
Multiple Choice
19
Multiple Choice
Which sentence describes the relationship shown on this scatter plot?
As the temperature decreases, the visitors increase.
As the temperature increases, the number of visitors increases.
As the visitors increase, the temperature decreases.
No correlation
20
Multiple Choice
Scatterplot and Correlation Review (Topic 4 Quiz Prep)
Show answer
Auto Play
Slide 1 / 20
SLIDE

Similar Resources on Wayground
16 questions
Functions
Presentation
•
8th Grade
16 questions
Perfect squares
Presentation
•
8th Grade
14 questions
8.F.4 Standard Form to Slope Intercept Form Mini Assessment
Presentation
•
8th Grade
15 questions
Finding Cylinder Dimensions
Presentation
•
8th Grade
13 questions
Slope of a Line
Presentation
•
8th Grade
17 questions
Linear and Non-Linear Functions
Presentation
•
8th Grade
15 questions
Multiplying Powers Of Ten
Presentation
•
8th Grade
16 questions
Input & Output Tables Lesson
Presentation
•
8th Grade
Popular Resources on Wayground
11 questions
Hallway & Bathroom Expectations
Quiz
•
6th - 8th Grade
10 questions
HCS SCI 03 Summer School Assessment 2
Quiz
•
3rd Grade
11 questions
Home Scope
Quiz
•
7th - 8th Grade
12 questions
2026 TAP Technology in the Classroom
Presentation
•
Professional Development
15 questions
HCS SCI 05 Summer School Assessment 2 Review
Quiz
•
5th Grade
15 questions
HCS SCI 04 Summer School Review 2
Quiz
•
4th Grade
59 questions
Geometry Unit 3 Review
Quiz
•
9th - 12th Grade
14 questions
FAST ELA READING SMAPLE TEST MATERIALS
Passage
•
3rd Grade