Search Header Logo
Speed/Time Graphs

Speed/Time Graphs

Assessment

Presentation

Mathematics, Science

8th Grade

Easy

CCSS
HSF.IF.B.4, 8.EE.B.5

Standards-aligned

Created by

Blake LeCroy

Used 231+ times

FREE Resource

6 Slides • 10 Questions

1

Speed/Time Graphs

by Blake LeCroy

media

​Speed/Time Graphs

2

media

3

media

Time Speed

4

media

5

media

6

media

7

Multiple Choice

Match the graph to the description:

"The car is stopped."

1
2
3
4

8

Multiple Choice

Match the graph to the description:

"The car is traveling at a constant speed."

1
2
3
4

9

Multiple Choice

Match the graph to the description:

"The car is accelerating speeding up (positive acceleration)."

1
2
3
4

10

Multiple Choice

Match the graph to the description:

"The car is slowing down (negative acceleration)."

1
2
3
4

11

Multiple Choice

Question image

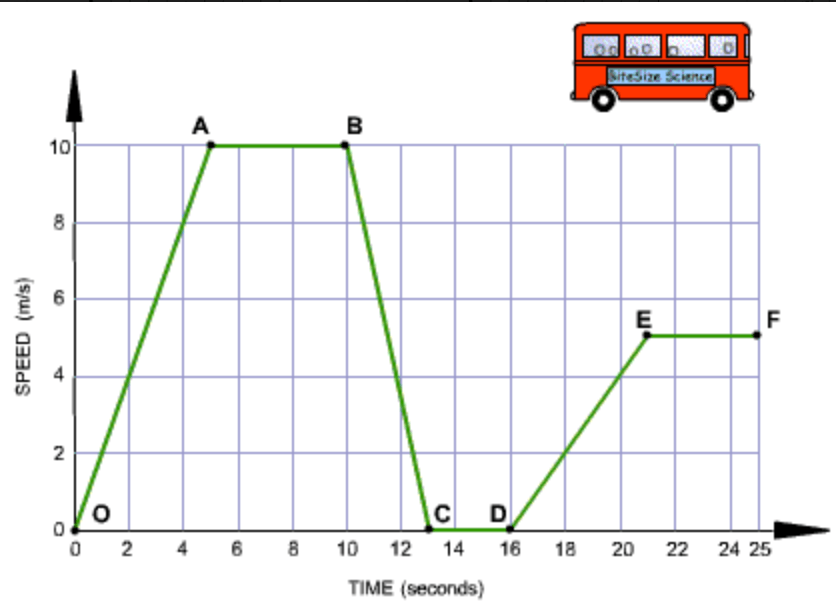
Segment O-A: The bus is _________________. It's speed changes from 0m/s to 10 m/s in 5 seconds.

1

accelerating

2

decelerating

3

constant speed

4

at rest

12

Multiple Choice

Question image

Segment A-B: The bus is moving at a _________________ of 10 m/s for 5 seconds.

1

accelerating

2

decelerating

3

constant speed

4

at rest

13

Multiple Choice

Question image

Segment B-C: The bus is _________________. It is slowing down from 10 m/s rest in 3 seconds.

1

accelerating

2

decelerating

3

constant speed

4

at rest

14

Multiple Choice

Question image

Segment C-D: The bus is _________________. It has stopped.

1

accelerating

2

decelerating

3

constant speed

4

at rest

15

Multiple Choice

Question image

Segment D-E: The bus is _________________. It is gradually increasing it's speed.

1

accelerating

2

decelerating

3

constant speed

4

at rest

16

Multiple Choice

Question image

Segment E-F: The bus is moving at a _________________ of 5 m/s for 4 seconds.

1

accelerating

2

decelerating

3

constant speed

4

at rest

Speed/Time Graphs

by Blake LeCroy

media

​Speed/Time Graphs

Show answer

Auto Play

Slide 1 / 16

SLIDE