Search Header Logo
  1. Resource Library
  2. Math
  3. Probability And Statistics
  4. Regression
  5. Alg Unit 7 Day 2 Linear Regression Applications
Alg Unit 7 Day 2 Linear Regression Applications

Alg Unit 7 Day 2 Linear Regression Applications

Assessment

Presentation

•

Mathematics

•

8th - 9th Grade

•

Easy

•
CCSS
6.SP.B.4, 6.SP.B.5C, HSF-LE.A.1B

+5

Standards-aligned

Created by

Darryl Padgett

Used 3+ times

FREE Resource

13 Slides • 16 Questions

1

Linear Regression Applications

By Darryl Padgett

2

Multiple Choice

Question image

What is the median of the data?

1

10

2

12

3

13

4

14

5

18

3

Multiple Choice

Question image

What percent of the data falls between 8 and 10 absences?

1

0%

2

25%

3

50%

4

75%

5

100%

4

Multiple Choice

What is the interquartile range for this data?

8, 12, 14, 4, 5, 16, 7, 14

1

6

2

8

3

10

4

12

5

Multiple Choice

33, 25, 42, 25, 31, 37, 46, 29, 38
What is the third quartile (IQ3) of the data?

1
37
2
38
3
40
4
46

6

Multiple Choice

Question image
What data value is the upper quartile (Q3)?
1
64
2
62
3
66
4
58

7

Enter Data in Desmos in a list.

media

8

media

9

media

10

media

11

media

12

media

13

media

14

Categorize

Options (6)
Question image
Question image
Question image
Question image
Question image
Question image

Classify the scatter plot

Positive
Negative
None

15

Multiple Choice

Question image

Does this graph have a positive, negative, or no relationship correlation?

1

positive relationship

2

negative relationship

3

no relationship

16

Multiple Choice

Question image
The scatter plot below shows the number of books read by students in Mrs. Hall’s English class and their final grades. Which statement represents the best description about the line of best fit? 
1
The more books students read, the lower their English grade.
2
The more books students read, the higher their English grade.
3
The fewer books students read, the higher their English grade. 
4
No relationship exists between the number of books students read and their English grades. 

17

Multiple Choice

Question image

What type of correlation does this graph show?

1

Positive correlation

2

Negative correlation

3

No correlation

4

Constant correlation

18

media

19

media

20

Fill in the Blanks

media image

How much will I earn if I spend $2500 in advertisement dollars? Remember your answers should be in currency (do not use commas). ie $18536.37 or $1236.77

Type answer...

21

Multiple Choice

Question image

What is the correlation of the data?

1

Positive Correlation

2

Negative Correlation

3

No Correlation

22

media

23

media

24

Multiple Choice

Question image

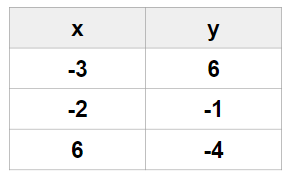
Write the linear regression equation for the following data points. Round to the nearest hundredth.

1

y=−0.83x+0.61y=-0.83x+0.61

2

y=−0.83x+0.63y=-0.83x+0.63

3

y=0.83x+−0.8y=0.83x+-0.8

4

y = -0.828767x + 0.609589

25

Multiple Choice

Question image
If Joe worked 30 hours, how much is he expected to earn?
1
$600
2
$200
3
$1000
4
$800

26

Multiple Choice

Question image
Make a prediction for a resting heart rate after 6 hours of exercise a week.
1
6
2
50
3
55
4
59

27

Open Ended

Question image

How well did you understand today's lesson? One of your classmates is absent today.  Write down one item that they should know based upon today’s lesson.

28

media

29

Multiple Choice

Question image

Which relationship is shown by this scatter plot?

1

As the cost goes down, the number sold goes down. 

2

As the cost goes up, the number sold goes down. 

3

As the cost does down, the number sold remains the same. 

4

There is no relationship between cost and the number sold. 

pattern-tertiary
Linear Regression Applications

By Darryl Padgett

Show answer

Auto Play

Slide 1 / 29

SLIDE