Search Header Logo
Graphing Practice

Graphing Practice

Assessment

Presentation

Biology

9th Grade

Medium

NGSS
MS-PS2-2, MS-ESS3-5, MS-LS2-1

+4

Standards-aligned

Created by

Walter HS]

Used 304+ times

FREE Resource

5 Slides • 13 Questions

1

There are lots of parts of a graph

  • Title

  • X-Axis Label

  • Y-Axis Label

  • Scales

  • Legend

media

2

Title

  • Tells you what the graph is about

  • Includes the dependent and independent variables

media

3

X-Axis Label

  • Tells you what the x-axis (horizontal/bottom line) is showing

  • Independent Variable

  • Matches the different trails in the experiment

media

4

Multiple Choice

In an experiment to determine the effects of listening to loud music on test scores, what would the x-axis label be?

1

Type of music

2

Test score

3

Volume of music

4

Grade in class

5

Trends in Graphs

As the time increases the mass of chalk decreases.

media

6

Trends in Graphs

As time increases, the speed increases.

media

7

Multiple Choice

Question image

Describe the trend shown in the graph.

1

As the volume decreases, the mass stays the same.

2

As the mass decreases, the volume increases.

3

As the volume increases, the mass increases.

4

As the mass increases, the volume stays the same.

8

Multiple Choice

Question image

What conclusions can you draw from this graph?

1

The deer population went down over time.

2

The deer population went up over time.

3

The deer population went up quickly, then down, but then stayed the same.

4

There are less deer because of hunters

9

Multiple Choice

Question image

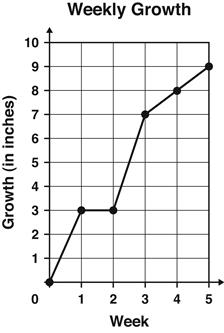
The graph shows the number of inches a plant grew each week.

Between which 2 weeks did the plant grow the MOST?

1

Week 1 and Week 2

2

Week 2 and Week 3

3

Week 3 and Week 4

4

Week 4 and Week 5

10

Multiple Choice

The variable that is measured.

1

Controlled Variable

2

Dependent Variable

3

Independent Variable

11

Multiple Choice

The one factor that a scientist changes during an experiment.

1

Controlled Variable

2

Dependent Variable

3

Independent Variable

12

Multiple Choice

Changes in the _________ variable causes changes in the _________ variable.
1
independent; dependent
2
dependent; independent

13

Multiple Choice

Question image
This graph provides evidence to support the claim that
1
the enhanced greenhouse effect is occurring
2
the greenhouse effect is occurring
3
humans are changing the planet
4
CO2 is decreasing but temperature is increasing

14

Multiple Choice

Question image
The x-axis shows
1
time
2
temperature
3
carbon dioxide
4
parts per million

15

Multiple Choice

On which axis is the independent variable found?
1
z-axis
2
w-axis
3
y-axis
4
x-axis

16

Multiple Choice

Display that shows change over time
1
Line Graph
2
Line Plot
3
Box Plot
4
Histogram

17

Multiple Choice

Question image
How many students have blue for a favorite color?
1
11
2
12
3
14
4
17

18

Multiple Choice

Question image

the pie chart shows the different types of vehicles involved in road accidents in a city last years.

which type of vehicles had the highest number of road accidents last year?

1

Motorcycle

2

Cars

3

Good Vehicles

4

Buses

There are lots of parts of a graph

  • Title

  • X-Axis Label

  • Y-Axis Label

  • Scales

  • Legend

media

Show answer

Auto Play

Slide 1 / 18

SLIDE