

AP STATS CH 1 Test Review + Ice Breaker
Presentation
•
Mathematics
•
10th - 12th Grade
•
Medium
Stephanie Balbaneda
Used 6+ times
FREE Resource
2 Slides • 23 Questions
1
Chapter 1 Test Review
9/8 + 9/9
(per6 +Per 3)
Grab your calculators!
Ms. Balbaneda
2
Multiple Choice
3
Multiple Select
Which of the following is a measure of spread, or variability?
(select all that apply)
Interquartile Range
Standard Deviation
Mean
Median
Range
4
Multiple Choice
What does standard deviation represent?
How many different variations are in the data set.
How the population varies compared to the sample.
How spread out each data value is from the mean.
The range, but with a bunch of other stuff going on.
5
Multiple Choice
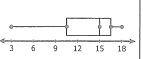
The ages of the employees at Company A tend to be closer together, than those at Company B.
True
False
6
Multiple Choice
When you are finding the MEDIAN and 2 numbers are in the middle, what do you do?
List both of the numbers as the Median.
Add the two numbers together and divide by 2.
Pick the one that you want.
7
Multiple Choice
The number of miles Jenna ran each week is shown:
28, 31, 36, 36, 42, 48, 52
What is the median number of miles Jenna ran?
24
39
36
8
Multiple Choice
What is the MEDIAN of this set of data?
10, 20, 30, 40, 50, 60, 70, 80, 90, 100
50
60
55
9
Multiple Choice
10
Multiple Choice
Look at each data set's standard deviation.
Set 1: 15.9
Set 2: 14.64
Set 3: 17.88
Which set of data has values that are closer in relation to the mean value of the data?
Set 1
Set 2
Set 3
Not enough information is provided
11
Multiple Choice
Use the interquartile range to identify any outliers in the following data.
52, 63, 55, 56, 62, 54, 59, 60, 53, 61, 88
No outliers.
88 is an outlier.
12
Multiple Choice
2, 5, 12, 15, 19, 4, 6, 11, 16, 18, 12, 12, 42
What effect does removing the outlier have on the distribution of the data?
13
Multiple Choice
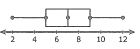
The boxplots on the right provide starting annual salaries for business majors (top boxplot) and education majors (bottom boxplot). Approximately what percent of education majors start making at least $39,000?
25%
50%
75%
100%
14
Multiple Choice
What percent of students have a height between 58 inches and 60 inches?
25%
50%
75%
100%
15
Multiple Choice
16
Multiple Choice
17
Multiple Choice
Which of the following best describes the shape of the distribution?
skewed left
skewed right
uniform
symmetrical
18
Fill in the Blanks
Type answer...
19
Multiple Choice
Which of the following best describes the shape of the distribution?
skewed left
skewed right
uniform
symmetrical
20
Multiple Choice
Given that the data is symmetric, which pair of measures should be used to represent the data?
center: median
spread: standard deviation
center: mean
spread: IQR
center: mean
spread: standard deviation
center: median
spread: IQR
21
Multiple Choice
Which of the following best describes the shape of the distribution?
skewed left
skewed right
uniform
symmetrical
22
Fill in the Blanks
Type answer...
23
Multiple Choice
Which describes the shape of the distribution?
skewed right
skewed left
symmetric
uniform
24
Multiple Choice
Because this distribution is ____________ to the ___________, we would use the ______________ for the center and the _____________ for the spread of the data.
symmetric, middle, median, IQR
skewed, left, median, IQR
skewed, left, mean, IQR
skewed, right, median, standard deviation
25
TIME TO TEST!
ONE CHEAT SHEET
HALF A PAGE
2 sided
MS. BALBANEDA
Chapter 1 Test Review
9/8 + 9/9
(per6 +Per 3)
Grab your calculators!
Ms. Balbaneda
Show answer
Auto Play
Slide 1 / 25
SLIDE
Similar Resources on Wayground
18 questions
Simplifying Square Roots
Presentation
•
9th - 12th Grade
20 questions
Types of Triangles
Presentation
•
10th - 12th Grade
18 questions
Sampling and Bias Review
Presentation
•
10th - 12th Grade
19 questions
Writing Exponential Functions
Presentation
•
9th - 12th Grade
19 questions
Equations of Exponential Functions
Presentation
•
9th - 12th Grade
22 questions
Intro to Trigonometry
Presentation
•
10th - 12th Grade
18 questions
Rational and Radical Expressions
Presentation
•
9th - 12th Grade
Popular Resources on Wayground
19 questions
Naming Polygons
Quiz
•
3rd Grade
10 questions
Prime Factorization
Quiz
•
6th Grade
20 questions
Math Review
Quiz
•
3rd Grade
15 questions
Fast food
Quiz
•
7th Grade
20 questions
Main Idea and Details
Quiz
•
5th Grade
20 questions
Context Clues
Quiz
•
6th Grade
20 questions
Inferences
Quiz
•
4th Grade
19 questions
Classifying Quadrilaterals
Quiz
•
3rd Grade
Discover more resources for Mathematics
5 questions
A.EO.1-4 Quizizz Day 1
Quiz
•
9th - 12th Grade
5 questions
A.EO.1-4 Quizizz Day 2
Quiz
•
9th - 12th Grade
20 questions
Simple Probability
Quiz
•
10th Grade
30 questions
Geometry Final Exam Review
Quiz
•
10th Grade
25 questions
Algebra 1 EOC Review
Quiz
•
8th - 10th Grade
5 questions
A.EO.1-4 Quizizz Day 4
Quiz
•
9th - 12th Grade
10 questions
Guess the Disney Movie by the Song Challenge
Interactive video
•
6th - 10th Grade
20 questions
Basic Trig Ratios
Quiz
•
9th - 12th Grade