Search Header Logo
MA110 Statistics Benchhmark Review

MA110 Statistics Benchhmark Review

Assessment

Presentation

Mathematics

12th Grade

Practice Problem

Medium

CCSS
HSS.IC.B.3, HSS.ID.A.4, HSS.CP.A.4

+17

Standards-aligned

Created by

Zehra Dundar

Used 3+ times

FREE Resource

6 Slides • 48 Questions

1

Multiple Choice

Identify the POPULATION in the following question: What are the ages of the students at Clarke Middle School?
1

Students

2

Age

3

Clarke Middle School

2

Multiple Choice

What is the MODE of a data set?
1
The middle value
2
The number that occurs most frequently
3
The average
4
The difference between the max and min values

3

Multiple Choice

What is the RANGE of a data set?
1
The middle value
2
The number that occurs most frequently
3
The average
4
The difference between the max and min values

4

Multiple Choice

Which answer shows categorical data?
1
Age
2
Height
3
Number of cousins
4
Favorite singer

5

Multiple Choice

Which answer shows numerical data?
1
Favorite animal
2
Hours of sleep last night
3
Hair color
4
Elementary school you attended

6

Multiple Select

What is random sampling? (Choose all that apply)

1

A sampling method that favors a certain group over another

2

A sampling method where each member of the population has an equal chance of being selected

3

Sampling method used to avoid bias and other unwanted effects

7

Multiple Choice

Question image

What is the interquartile range of test scores for 1st Period?

1

70-95

2

75-90

3

15

4

10

8

Multiple Choice

Question image

What kind of correlation?

1

Positive

2

Negative

3

No Correlation

9

Multiple Choice

Question image

How many cities have temperatures between 70 degrees and 99 degrees?

1

44

2

26

3

34

4

62

10

Multiple Choice

What kind of sample technique is the following:


Select at random 150 parents and send them a survey.

1

Convenience Sampling

2

Simple Random Sampling

3

Systematic Sampling

4

Sample

11

Multiple Choice

What kind of sample technique is the following:


Question every 5th person you see in the school hallway.

1

Convenience Sampling

2

Simple Random Sampling

3

Systematic Sampling

4

Sample

12

Multiple Choice

What kind of sample technique is the following:


Survey the students in your classroom.

1

Convenience Sampling

2

Simple Random Sampling

3

Systematic Sampling

4

Sample

13

Multiple Choice

Farmer Joe separates his apple tree farm into 10 regions.  He counts the number of apples produced in just one of the regions and uses that estimate to predict the number of apples produced on the whole farm.  This is _______ sampling.
1
Simple
2
Cluster
3
Stratified
4
Systematic

14

Multiple Choice

A study is done to see how high soda will erupt when mint candies are dropped into two-liter bottles of soda. You want to compare using one mint candy, five mint candies, and 10 mint candies. You design a cylindrical mechanism, which drops the desired number of mint candies all at once. You have 15 bottles of soda to use. You randomly assign five bottles into which you drop one candy, five into which you drop five candies, and five into which you drop 10 candies. For each bottle, you record the height of the eruption created after the candies are dropped into it.


What type of study is described?

1

Survery

2

Experimental Study

3

Observational Study

15

Multiple Choice

A company develops a new dog food. The company wants to know if dogs would prefer its new food over the competition’s dog food. One hundred dogs, who were food deprived overnight, were given equal amounts of the two dog foods: the new food versus the competitor’s food. The proportion of dogs preferring the new food versus the competitor’s was recorded.


What type of study is described?

1

Survey

2

Experimental Study

3

Observational Study

16

Multiple Choice

Source of bias that occurs when you ask people who are EASY to ask

1

Response Bias

2

Convenience Sampling

3

Nonresponse

4

Voluntary Response

17

Multiple Choice

Source of bias in which some groups of populations are LEFT OUT of the selection process

1

Response Bias

2

Undercoverage

3

Convenience Sampling

4

Voluntary Response

18

Multiple Choice

Many websites like Amazon and Yelp include customer ratings and reviews of products, restaurants, hotels, and so on. What is the predominant bias evident in these ratings and reviews?

1

Response Bias

2

Non-Response Bias

3

Undercoverage Bias

4

Voluntary Response Bias

19

Multiple Choice

Question image
How many students got a perfect score on the test?
1
0
2
2
3
6
4
1

20

Multiple Choice

Question image

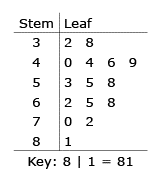
A florist records the amount of money he spent on gasoline each week to deliver orders. The list shows the data for 16 weeks.

32, 38, 40, 44, 44, 46, 49, 53, 55, 58, 62, 65, 68, 70, 72, 81

He put the data in a stem-and-leaf plot. What number did he leave out of the stem-and-leaf plot?

1

32

2

44

3

65

4

84

21

Fill in the Blanks

media image

Type answer...

22

Multiple Choice

Question image
The scatter plot below shows the number of books read by students in Mrs. Hall’s English class and their final grades. Which statement represents the best description about the line of best fit?
1
The more books students read, the lower their English grade.
2
The more books students read, the higher their English grade.
3
The fewer books students read, the higher their English grade. 
4
No relationship exists between the number of books students read and their English grades. 

23

Multiple Choice

Question image
The linear regression equation for the data is  y = 1.5x + 12.  Interpret the slope of the equation.
1
The slope is (0, 1.5).  It means that a pizza with 0 toppings will cost $1.50.
2
The slope is 1.5.  It means that it costs $1.50 per topping.
3
There are 1.5 toppings.
4
There are 1.5 pizzas.

24

Multiple Choice

Question image
Estimate the value of r:
1
0.03
2
-0.99
3
0.79
4
-0.72

25

Multiple Choice

Question image
If Gold's Gym is looking to buy 30 TVs, how much will each one cost?
1
400
2
750
3
1250
4
0

26

Multiple Choice

Scatterplots

1

Are the line of best fit.

2

Are a numerical measure of the direction and strength of a linear association.

3

Show the relationship between two quantitative variables measured on the same cases.

4

Are a point that doesn’t fit the overall pattern.

27

Multiple Choice

Which correlation coefficient shows the strongest linear relationship between x and y?

1

0.97

2

-0.02

3

0.86

4

-0.99

28

Multiple Choice

A linear regression equation of best fit between how often someone runs and their weight (in kg) is w = 90.21 - 1.14r. The correlation coefficient would be

1

0<r<1

2

-1<r<0

3

r=1

4

r=-1

29

Multiple Choice

If the value we are looking for is smaller than the mean, the value of z is:

1

Not enough information

2

Negative

3

Positive

4

0

30

Multiple Choice

Question image

What's the probability of the gray area?

(Mean = 55, Standard dev = 2.5)

1

0.8185

2

0.8413

3

0.8641

4

0.8389

31

Multiple Choice

What's the probability of x < 13 ?

(Mean = 20, Standard dev = 6.5)

1

0.1423

2

0.1401

3

0.0446

4

0.0359

32

Multiple Choice

Question image

Based on the graph, who has the highest IQ?

1

You

2

Me

3

Both have the same

4

Not enough information

33

Multiple Choice

According to the empirical rule, how much of the data falls within 3 standard deviations? 
1
25%
2
68%
3
95%
4
99.7%

34

Multiple Choice

When labeling the axis for a normal distribution curve, the notation σ\sigma  is used to represent standard deviation. What is this Greek letter  σ\sigma  called?

1

Omega

2

Delta

3

Lowercase Sigma

4

Lowercase Omega

35

Multiple Choice

Use the following information and the Empirical Rule to estimate the answer.


The ages of golfers are normally distributed, with a mean of 38 and a standard deviation of 4.


Find the proportion of golfers that are between 30 and 46 years old.

1

68%

2

94%

3

95%

4

99.7%

36

Standard Deviation

The standard deviation on a bell curve is what the x axis is going up and down by. On the graph given, the standard deviation is 5 because the graph is going up and down by 5.

media

37

Normal Distribution

The mean is always at the center of the normal distribution curve.

media

38

media

39

media

40

media

41

Multiple Choice

Question image
What is P(Foreign language | Sport)?
1
14/27
2
7/12
3
23/47
4
37/47

42

Multiple Choice

Question image
What is the probability that a female is chosen given they like a Toyota? 
1
.525
2
.4627
3
.6774
4
.3143

43

Multiple Choice

Question image
What is the probability that the person picked will be a boy given they speak german? 
1
.7273
2
.4
3
.16
4
.22

44

media

45

Multiple Choice

Question image

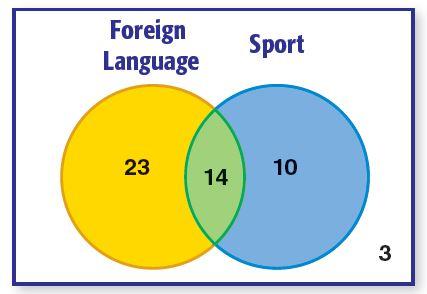
How many total people were surveyed?

1

224

2

448

3

131

4

146

46

Multiple Choice

Question image
What is the probability that they speak French given they are a girl? 
1

2.14

2

.24

3

.4

4

.8571

47

Multiple Choice

Question image
P(Sandals|Pants):
1

4/20

2

6/15

3

1/2

4

2/7

48

Multiple Choice

Question image

Find P(M&M | kid)

1

7194\frac{7}{194}  

2

90194\frac{90}{194}  

3

790\frac{7}{90}  

49

Multiple Choice

P(A) = 0.6. Find P(not A)

1

0.6

2

0.24

3

0.10

4

0.4

50

Multiple Choice

The probability of using Apple Music is 0.75. What is the probability of not using it?

1

0.25

2

0.75

3

0.1875

4

0.5

51

Multiple Choice

Question image

Determine probability of rolling four standard six-sided dice, what is the probability that all land on a 4 or greater

1

(26)(26)(26)(26)\left(\frac{2}{6}\right)\left(\frac{2}{6}\right)\left(\frac{2}{6}\right)\left(\frac{2}{6}\right)  

2

(36)(36)(36)(36)\left(\frac{3}{6}\right)\left(\frac{3}{6}\right)\left(\frac{3}{6}\right)\left(\frac{3}{6}\right)  

3

(46)(46)(46)(46)\left(\frac{4}{6}\right)\left(\frac{4}{6}\right)\left(\frac{4}{6}\right)\left(\frac{4}{6}\right)  

4

(56)(56)(56)(56)\left(\frac{5}{6}\right)\left(\frac{5}{6}\right)\left(\frac{5}{6}\right)\left(\frac{5}{6}\right)  

52

Multiple Choice

Determine probability of rolling four standard six-sided dice, what is the probability that all land on a 5 or greater

1

(26)(26)(26)(26)\left(\frac{2}{6}\right)\left(\frac{2}{6}\right)\left(\frac{2}{6}\right)\left(\frac{2}{6}\right)  

2

(36)(36)(36)(36)\left(\frac{3}{6}\right)\left(\frac{3}{6}\right)\left(\frac{3}{6}\right)\left(\frac{3}{6}\right)  

3

(46)(46)(46)(46)\left(\frac{4}{6}\right)\left(\frac{4}{6}\right)\left(\frac{4}{6}\right)\left(\frac{4}{6}\right)  

4

(56)(56)(56)(56)\left(\frac{5}{6}\right)\left(\frac{5}{6}\right)\left(\frac{5}{6}\right)\left(\frac{5}{6}\right)  

53

Multiple Choice

Based upon the definition of independence, determine if the set of events are independent:
P(A)=0.12     P(B)=0.56    P(AB)=0.0672P\left(A\right)=0.12\ \ \ \ \ P\left(B\right)=0.56\ \ \ \ P\left(A\cap B\right)=0.0672  

1

Yes, they are independent

2

No, they are not independent

54

Multiple Choice

Based on the definition of independence, determine if the following set of events are independent: P(A)=0.45     P(B)=0.30   P(AB)=0.75P\left(A\right)=0.45\ \ \ \ \ P\left(B\right)=0.30\ \ \ P\left(A\cap B\right)=0.75  

1

Yes, they are independent

2

No, they are not independent

Identify the POPULATION in the following question: What are the ages of the students at Clarke Middle School?
1

Students

2

Age

3

Clarke Middle School

Show answer

Auto Play

Slide 1 / 54

MULTIPLE CHOICE