
grade 7 math unit 5
Presentation
•
Mathematics
•
KG
•
Practice Problem
•
Hard

Maryam Munir
FREE Resource
2 Slides • 29 Questions
1
Multiple Choice
2
Multiple Choice
3
Multiple Choice
4
Multiple Choice
5
Multiple Choice
6
Multiple Choice

7
Multiple Choice
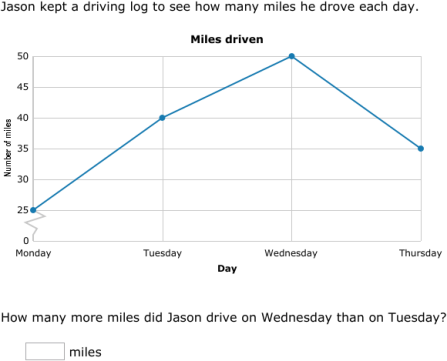
How many more miles did Ariana drive on Wednesday than on Tuesday?
8
Multiple Choice
9
Multiple Choice
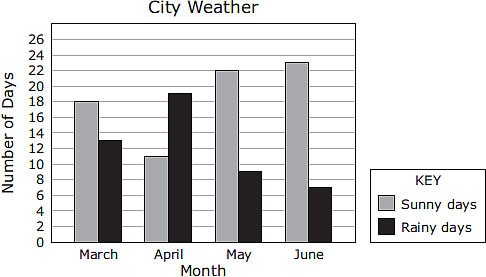
Based on the graph,how many more sunny days than rainy days did this city have during the months of April, May, and June?
10
Multiple Choice
11
Multiple Choice

What is the least popular social media platform for ages 30-49?
12
Multiple Choice

13
Multiple Choice
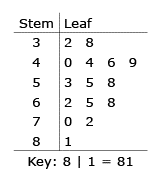
A florist by the name of Gurman records the amount of money she spent on gasoline each week to deliver orders. The list shows the data for 16 weeks.
32, 38, 40, 44, 44, 46, 49, 53, 55, 58, 62, 65, 68, 70, 72, 81
She put the data in a stem-and-leaf plot. What number did she leave out of the stem-and-leaf plot?
14
Multiple Choice
15
Multiple Choice
16
Multiple Choice

17
Multiple Choice

What percent of people listened to the three most popular radio stations?
18
Multiple Choice

500 people were surveyed. How many people preferred listening to CJAB? (Hint: The percent OF 500)
19
Multiple Choice

What is the largest number?
20
Multiple Choice
21

22
Open Ended
23
Multiple Choice
24
Poll

Which graph appears to show a steeper increase in price?
25
Multiple Choice

Which graph should be used if...
You want to tell people that ticket sales keep going up, and it's ridiculous!
26
Multiple Choice

Which graph should be used if...
You want people to think that your business is extremely profitable.
27

28
Open Ended

In at least two sentences, explain what is misleading about this graph. (Zoom in to enlarge graph)
29
Open Ended

Explain how is this graph misleading (confusing).
30
Open Ended
31
Open Ended

Explain how is this graph misleading.
Show answer
Auto Play
Slide 1 / 31
MULTIPLE CHOICE
Similar Resources on Wayground

25 questions
8th grade math review Slope and Equations
Lesson
•
8th Grade
26 questions
Module 2 lesson 21 lesson
Lesson
•
5th Grade
24 questions
Solving Real-World Multistep Equations
Lesson
•
7th - 9th Grade
24 questions
7.NS.1 Quiz (Adding and Subtracting Integers
Lesson
•
7th Grade
24 questions
Numeric Expressions with Exponents
Lesson
•
6th Grade
24 questions
Area of Circles
Lesson
•
7th Grade
24 questions
Constant of Proportionality
Lesson
•
7th Grade
25 questions
Solving Equations Using Distributive Property
Lesson
•
7th - 8th Grade
Popular Resources on Wayground
15 questions
Fractions on a Number Line
Quiz
•
3rd Grade
10 questions
Probability Practice
Quiz
•
4th Grade
15 questions
Probability on Number LIne
Quiz
•
4th Grade
20 questions
Equivalent Fractions
Quiz
•
3rd Grade
25 questions
Multiplication Facts
Quiz
•
5th Grade
22 questions
fractions
Quiz
•
3rd Grade
6 questions
Appropriate Chromebook Usage
Lesson
•
7th Grade
10 questions
Greek Bases tele and phon
Quiz
•
6th - 8th Grade
Discover more resources for Mathematics
20 questions
Place Value
Quiz
•
KG - 3rd Grade
10 questions
Add & Subtract Mixed Numbers with Like Denominators
Quiz
•
KG - University
10 questions
2D & 3D Shapes
Quiz
•
KG
6 questions
2D Shapes
Lesson
•
KG - 3rd Grade
15 questions
Simple Patterns AB, ABB, ABC
Quiz
•
KG - 1st Grade
16 questions
3D Shapes
Quiz
•
KG - 1st Grade
15 questions
2D and 3D shapes
Quiz
•
KG
12 questions
tens and ones
Quiz
•
KG - 1st Grade