
U1L4 - Lecture Notes - Representing Data
Presentation
•
Chemistry
•
9th - 12th Grade
•
Easy

Bryan Vaughan
Used 18+ times
FREE Resource
8 Slides • 12 Questions
1

2

3

4
Multiple Choice

Which Continent is home to 13% of wild cats?
5
Multiple Choice
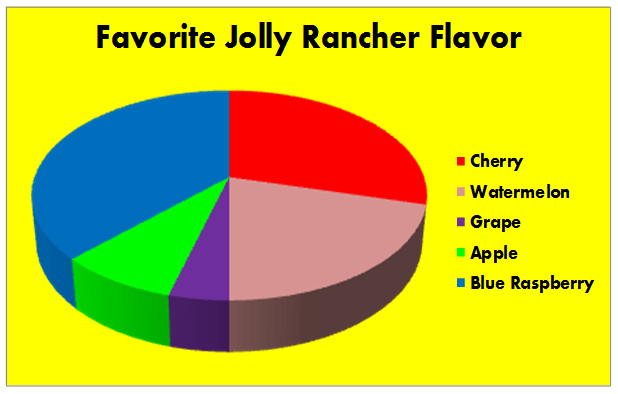
According to this graph, what is the most popular flavor of Jolly Rancher?
6

7
Multiple Choice

How many total people took the survey?
8
Multiple Choice
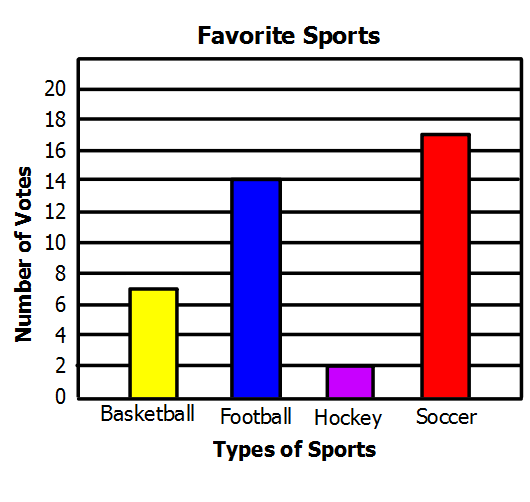
How many students voted for their favorite sport?
9

10
Multiple Choice
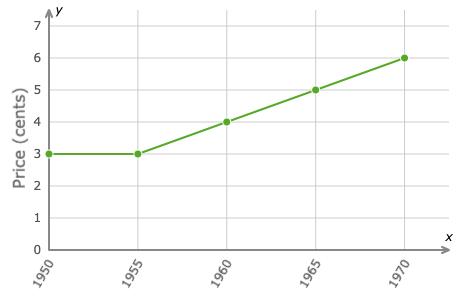
How much was a stamp in 1965?
11
Multiple Select
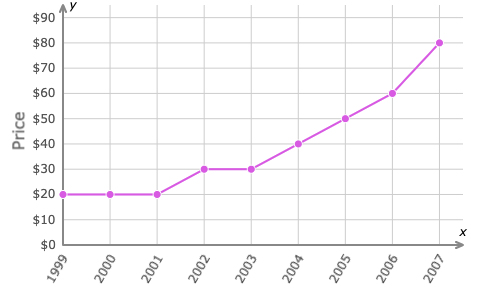
What years was the price $30.00?
12

13
Multiple Choice
14
Multiple Choice
15
Multiple Choice
16
Multiple Choice
17

18
Multiple Choice

Estimating a value inside a set of data is...
19
Multiple Choice

Estimating a value outside a set of data is...
20

Show answer
Auto Play
Slide 1 / 20
SLIDE
