
Function - Domain & Range
Presentation
•
•
Hard

Lisa Fales
FREE Resource
9 Slides • 80 Questions
1
2

3

4

5

6
Fill in the Blanks
7
Fill in the Blanks
8
9
Multiple Choice
10
Multiple Choice
11
Multiple Choice
12
13

14

15
Open Ended

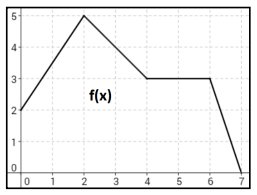
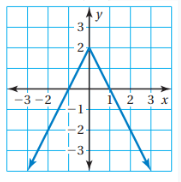
Find the domain of this graph.
Since it is a line segment with definite ends and there is an INTERVAL of points, we use brackets. Find the minimum and maximum x values and separate them with a comma inside brackets.
16
Fill in the Blanks

Type answer...
17
Poll
18
Open Ended
19
Multiple Choice

20
Multiple Choice

21
Multiple Choice

22
Multiple Choice

23
Multiple Choice

24
Multiple Choice

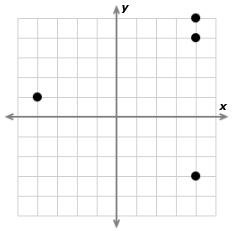
If you have an x value that has 2 "y" values it is NOT a function!
25
Multiple Choice

26
Multiple Choice
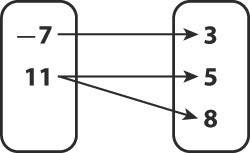
Is the relation shown a function?
27
Multiple Choice

Find the Range.
28
Multiple Choice

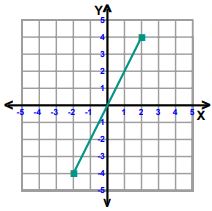
What is the Domain of this linear function?
29
Multiple Choice
30
Multiple Choice
31
Multiple Choice
What is the domain in Interval notation?
32
Multiple Choice
What is the domain in inequality notation?
33
Multiple Choice
What is the range in interval notation?
34
Multiple Choice

What is the domain in interval notation?
35
Multiple Choice

What is the domain in interval notation?
36
Multiple Choice
What is the range in interval notation?
37
Multiple Choice

What is the domain in interval notation?
38
Multiple Choice
What is the domain in inequality notation?
39
Multiple Choice

Is the following a function?
40
Multiple Choice

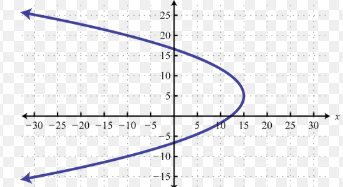
DOES THIS GRAPH REPRESENT A FUNCTION?
41
Multiple Choice

DOES THE GRAPH REPRESENT A FUNCTION?
42
Multiple Select

43
Multiple Choice

44
Multiple Choice
45
Multiple Choice
46
Multiple Choice
47
Multiple Choice

48
Multiple Choice

49
Multiple Choice

50
Multiple Choice

51
Multiple Choice

52
Multiple Choice

53
Multiple Choice
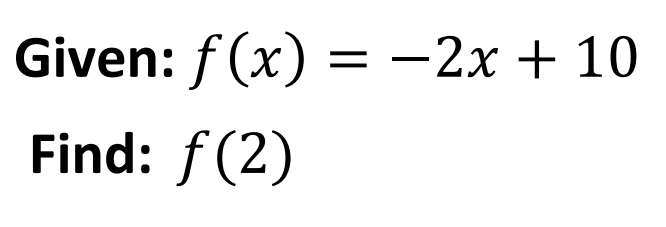
Find f(2)
54
Multiple Choice
Find f(3)
55
Multiple Choice
Find f(4)
56
Multiple Choice

Find f(-1)
57
Multiple Choice
Find f(-3)
58
Multiple Choice
If f(x) = 19, Find the value for x.
59
Multiple Choice
If f(x) = 4, Find the value for x.
60
Multiple Choice

Find f(1)
61
Multiple Choice
Find f(0)
62
Multiple Choice
If f(x) = 3 Find the value of x.
63
Multiple Choice

Find f(2)
64
Multiple Choice
Find f(2)
65
Multiple Choice
Find f(6)
66
Multiple Choice
Is this function linear or nonlinear?
67
Multiple Choice
Is the function represented by this graph linear or nonlinear?
68
Multiple Choice
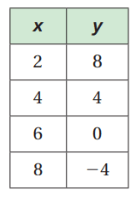
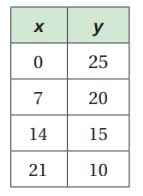
Is the function represented by this table linear or nonlinear?
69
Multiple Choice
70
Multiple Choice
71
Multiple Choice
72
Multiple Choice
Is this relation a function?
73
Multiple Choice
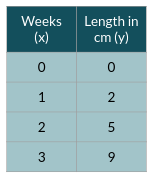
This table shows the height of my green bean plants that I planted a few weeks ago. Is this a linear or nonlinear function?
74
Multiple Choice
Which statement best describes this graph?
75
Multiple Choice

Is the graph pictured a linear or nonlinear function?
76
Multiple Choice

Is this function linear or nonlinear?
77
Multiple Choice

Is this function linear or nonlinear?
78
Multiple Choice

Is this function linear or nonlinear?
79
Multiple Choice

Which graph is linear?
80
Multiple Choice
81
Multiple Select
82
Multiple Choice
83
Multiple Select
84
Multiple Choice
85
Multiple Choice
86
Multiple Choice
Is this function linear or nonlinear?
87
Multiple Choice

Is this function linear or nonlinear?
88
Multiple Choice

89
Multiple Choice

Show answer
Auto Play
Slide 1 / 89
SLIDE
