Search Header Logo
Line Graph! B2.2

Line Graph! B2.2

Assessment

Presentation

English, Professional Development

KG

Practice Problem

Easy

Created by

Laura Posada

Used 6+ times

FREE Resource

2 Slides • 16 Questions

1

How do you describe a line graph?

A line graph plots data in a single line over time. To describe the graph, follow its progress along the horizontal access and describe whether it goes down, up, or stays the same.

media

2

Using transitional markers

To indicate addition (besides, moreover, furthermore, apart from that, additionally, in addition to that)

To indicate contrast (however, nevertheless, in contrats, on the contrary, on the other hand)

To indicate cause and effect (therefore, thus, hence, consequently, as a consequence, as a result)

To indicate comparison (similarly, likewise, also, in the same way)

3

Multiple Choice

Question image
Look at the graph.
Which is correct?
Sales of food and drink... from Monday to Friday.
1

remain stable

2

rise

3

drop 

4

fluctuate

4

Multiple Choice

Question image
Look at the graph.
From Tuesday to Wednesday there is ....
1

fall sharply.

2

a sharply fall.

3

a sharp fall.

4

fall sharp.

5

Multiple Choice

Question image
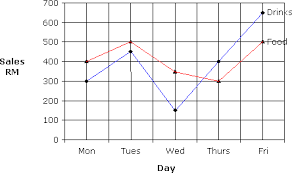
People buy more drinks on ____ than any other day.
1

Monday

2

Tuesday

3

Thursday

4

Friday

6

Multiple Select

upward trend

1

decline

2

decrease

3

growth

4

increase

7

Multiple Select

downward trend

1

drop

2

decrease

3

fall

4

rise

8

Fill in the Blank

Write the past form of "decline"

9

Fill in the Blank

Write the past form of "grow"

10

Multiple Choice

The number ____ graduates went up.

1

between

2

of

3

from

4

to

11

Multiple Choice

There was a rise _____ graduate numbers during the 1990s.

1

by

2

from

3

to

4

in

12

Multiple Choice

Which is the correct ending?
The number of gorillas ....
1
 ...decreased sharply.
2
..decreased sharp.
3
.. a sharp decrease.
4
.. sharply decrease.

13

Multiple Choice

Which is the correct ending?
Sales of Toyotas....... between 1990 and 2000.
1
increased gradual.
2
increased gradually.
3
a gradual increase.
4
a gradually increase.

14

Multiple Choice

We have seen _______ in the amount of rain this week
1
a large rise
2
a largely rise
3
rise large
4
rise largely.

15

Multiple Choice

The amount of students who passed increased ___ 2016
1
at
2
between
3
on
4
in

16

Multiple Choice

From 2010 ___ 2015, more tourists came to the UAE
1
and
2
to
3
between
4
in

17

Multiple Choice

The number of visitors to the UAE has increased ____ 1995.
1
from
2
for
3
since
4
between

18

Multiple Choice

The number of DVD's sold has been decreasing ______ many years.
1
in
2
for
3
since
4
from

How do you describe a line graph?

A line graph plots data in a single line over time. To describe the graph, follow its progress along the horizontal access and describe whether it goes down, up, or stays the same.

media

Show answer

Auto Play

Slide 1 / 18

SLIDE