Search Header Logo
Measures of Center and Variation

Measures of Center and Variation

Assessment

Presentation

Mathematics

9th - 12th Grade

Medium

Created by

Elizabeth Borkowski

Used 1+ times

FREE Resource

9 Slides • 19 Questions

1

media

Comparing Measures of

Center and Variation

Choosing the most appropriate measures

2

media

Appropriate Measures of Center and Variation

  • The shape of the distribution determines which measure of center
    and variability are best.

  • Use the mean and range for symmetrical distributions.

  • Use the median and IQR for asymmetrical distributions or distributions that have outliers.

media

​Symmetrical= mirror image on both sides

media
media

3

media
media

​Skewed displays are asymmetrical, which means they don't look the same on both sides. They can be skewed right or skewed left. Look for the "tail". The stem plot has a tail on the "right".

media

4

Multiple Choice

Question image

What is the shape of the distribution shown?

1

The distribution is skewed to the right.

2

The distribution is skewed to the left.

3

The distribution is approximately symmetrical.

4

The distribution is bimodal.

5

Multiple Choice

Question image

What is the shape of the distribution?

1

The distribution is approximately symmetrical.

2

The distribution is skewed to the right.

3

The distribution is skewed to the left.

4

The distribution is approximately uniform.

6

Multiple Choice

Question image

What shape is the distribution?

1

The distribution is approximately symmetrical.

2

The distribution is skewed to the left.

3

The distribution is skewed to the right.

4

The distribution is bimodal.

7

Multiple Choice

Question image

What shape is the distribution?

1

The distribution is skewed to the right.

2

The distribution is skewed to the left.

3

The distribution is approximately symmetrical.

4

The distribution is approximately uniform.

8

Multiple Choice

Question image

What is the shape of this data?

1

symmetric

2

skewed right

3

skewed left

4

uniform

9

Multiple Choice

Question image

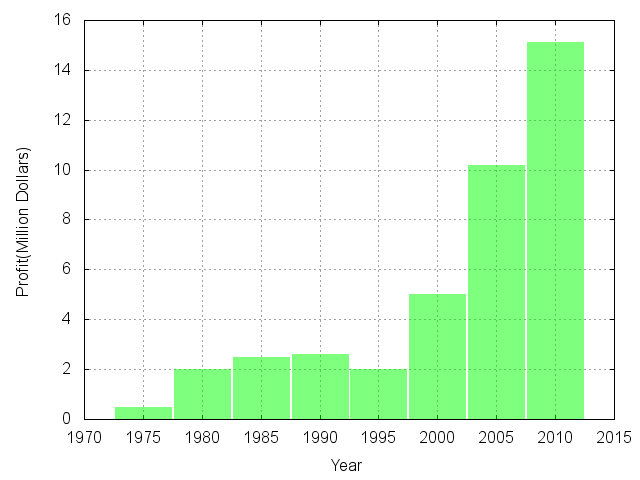
What is the shape of this bar graph?

1

Skew right

2

Skew left

3

Symmetrical

4

uniform

10

What is an outlier?

A data point that differs substantially from the other points.
The data point is far away from the other points.


Example:
1, 5, 8, 3, 2, 6, 8, 78 , 4

78 is an outlier because it is far away from the other points.

Definition:

media
media
media

11

Multiple Choice

Identify the outlier for the given data?
23, 34, 27, 7, 30, 26, 28, 31, 34
1
7
2
23
3
31
4
34

12

Multiple Choice

Identify the outlier for the given data?
23, 34, 27, 7, 30, 26, 28, 31, 34
1
7
2
23
3
31
4
34

13

media

Appropriate Measures of Center and Variation

  • The shape of the distribution determines which measure of center
    and variability are best.

  • Use the mean and range for symmetrical distributions.

  • Use the median and IQR for asymmetrical distributions or distributions that have outliers.

media

​Symmetrical= mirror image on both sides

media
media

14

media

"Resistant" Measures: A statistic that is not greatly influenced or affected by outliers or skew

  • Mean is not resistant to skew or outliers

  • Use mean as the measure of center for symmetric distributions

media
media
media
  • Median is resistant to skew or outliers

  • Use mean as the measure of center for skewed distributions or outliers

15

media

I would the mean as a measure of center and the range for a measure of variation because the dot plot is symmetrical. Mean is not resistant.

​Example:

16

Multiple Choice

Which measure of center best represents this set of data?
73, 75, 71, 72, 76
1

Mean because there is no outlier.

2

Median because there is an outlier.

3

Mode because there is a uniform distribution.

17

Multiple Choice

Which measure of center best represents this set of data?
12, 13, 11, 16, 31, 14, 10, 15
1
Mean
2
median
3
mode

18

Drag and Drop

Question image
I would use ​ ​
as the measure of center and ​
for the measure of variation because the ​
is ​
.
Drag these tiles and drop them in the correct blank above
median
stem and leaf plot
skewed
IQR
mean
dot plot
symmetrical

19

Drag and Drop

Question image
I would use ​​ ​
as the measure of center and ​ ​
for the measure of variation because the ​distribution is ​ ​
.
Drag these tiles and drop them in the correct blank above
median
skewed
IQR
mean
symmetrical
range

20

Drag and Drop

Question image
I would use ​​ ​ ​
as the measure of center and ​ ​ ​
for the measure of variation because the distribution has an ​ ​
.
Drag these tiles and drop them in the correct blank above
median
IQR
mean
outlier
range
skew
symmetric

21

Open Ended

Question image

The stem and leaf plot shows the scores on a recent math test. The teacher wants to know how spread out the scores are.

Find the best measure (range or IQR) for the teacher to use and explain its meaning in the context of the situation.

22

Open Ended

Question image

The line plot shows the ages of applicants to orchestra camp. The camp director wants to know the average age of the camp applicants.

Find the best measure (mean or median) for the camp director to use and explain its meaning in the context of the situation.

23

media

Median and IQR

Median - the middle value in an ordered data set

Roughly 50% of the data is below and above the median

Measures the typical value for data in a skewed distribution

NOT influenced by all data values

Interquartile Range (IQR) - the middle 50% of the data in a distribution

Found by subtracting the 1st quartile (Q1) from the 3rd quartile (Q3)

Measures the variability of a sample with a skewed distribution

24

media

Comparing Measures of Center

In a symmetric distribution, the mean and the median are
approximately the same.

In a right skewed distribution the mean tends to be greater than the
median.

In a left skewed distribution the mean tends to be less than the
median.

media

25

Drag and Drop

Question image
This distribution is ​
so we should use the ​
as a measure of center and the ​
as a measure of variability.
Drag these tiles and drop them in the correct blank above
right skewed
median
IQR
fairly symmetric
left skewed
mean
standard deviation
range
mode

26

Drag and Drop

Question image
This distribution is ​
so we should use the ​
as a measure of center and the ​
as a measure of variability.
Drag these tiles and drop them in the correct blank above
fairly symmetric
mean
range
left skewed
mode
median
IQR
right skewed

27

Multiple Choice

Question image

Which measure of center would we use with this data?

1

Mean, since the data is fairly symmetric.

2

Median, since the data is skewed.

3

Standard deviation, since the data is symmetric.

4

IQR, since the data is skewed.

28

Multiple Choice

Question image

Which measure of variation would we use with this data?

1

Mean, since the data is fairly symmetric.

2

Median, since the data is skewed.

3

Standard deviation, since the data is symmetric.

4

IQR, since the data is skewed.

media

Comparing Measures of

Center and Variation

Choosing the most appropriate measures

Show answer

Auto Play

Slide 1 / 28

SLIDE