Search Header Logo
Data

Data

Assessment

Presentation

Mathematics

6th - 8th Grade

Easy

Created by

Ibu K

Used 1+ times

FREE Resource

15 Slides • 25 Questions

1

Categorical vs. Numerical Data

What is the difference? 

media

2

What is DATA?  

Information and facts that can be collected to help people solve problems, understand trends or to simply entertain!  We will be reviewing two types of data: Categorical and Numerical.

3

This is data that has been collected and displayed.  What types of graphs do you recognize?  Why are graphs helpful?

media

4

What is categorical data?

 A collection of data that can be put into categories or groups.  Such as.......

5

 Breeds of Dogs!

media

6

Genres of books!

media

7

What is numerical data

These data are expressed in number form, (NOT words or letters), such as......

8

Your height! (How tall you are.)

media

9

Time spent walking!

media

10

Multiple Choice

Which is an example of categorical data?

1

favorite team sports?

2

the number of red jellybeans in a box?

3

how much money in your piggy bank?

11

Multiple Choice

What is an example of numerical data?

1

most popular video game?

2

how much each dog weighs (how heavy)?

3

favorite day of the week

12

There are 2 types of QUANTITATIVE data​

13

media

14

Multiple Choice

Question image

Gender

1

Categorical

2

Discrete

3

Continuous

15

Multiple Choice

Question image

Height

1

Categorical

2

Discrete

3

Continuous

16

DISPLAYING DATA: DOT PLOTS

To answer statistical questions we collect data. Numerical data can be summarized using dot plots.

17

18

Multiple Choice

Question image

What is the median of the data?

1

2

2

1

3

3

4

12

19

Multiple Choice

Question image

How many total students were surveyed about their number of brothers and sisters? (add up all of the dots)

1

15

2

10

3

6

20

Multiple Choice

Question image

How many students have a shoe size bigger than 8?

1

2

2

3

3

4

4

9

21

Multiple Choice

The median is
1
The middle score
2
 Scores added & divided by the number of scores
3
The most frequent score
4
The middle when in order

22

Multiple Choice

Question image
What is the highest score in the class?
1
88%
2
100%
3
13
4
98%

23

Bar Graphs

  • Show categorical data

  • Categories listed on horizontal axis

  • Frequency shown on vertical axis

media

24

Histograms

  • Show numerical data

  • Work best with large data sets

  • Shows data in ranges (also known as "bins")

  • "Bins" are shown along horizontal axis

  • Frequency shown on vertical axis

media

25

Multiple Choice

Suppose the class was polled about their favorite kind of flower.


Which type of graph would you use to show this data?

1

Dot Plot

2

Bar Graph

3

Histogram

26

Multiple Choice

If our class were to take a poll on how far (in miles) their house is from the school, which type of graph would you use to show that data?

1

Dot Plots

2

Bar Graphs

3

Histograms

27

Multiple Choice

Question image

How many people in the survey were 40 years old or older?

1

23

2

18

3

52

4

60

28

Multiple Choice

Question image
600 people were surveyed. How many people rode the stationary bikes that day?
1
150 people
2
120 people
3
90 people
4
None of these

29

Multiple Choice

Question image
If there are 300 seventh graders, how many students prefer choir?
1
96
2
24
3
75
4
42

30

Multiple Choice

Question image

A survey asked 2,450 students which types of activities they are likely to participate in. The results of the survey are shown. How many students are likely to participate in computer programming or video games?

1

12

2

88

3

294

4

2156

31

Multiple Choice

Question image

Based on the graph, how many more students are in the science club than the book club?

1

20

2

16

3

46

4

18

32

Multiple Choice

Question image

The graph shows how employees at Disney World travel to work. How many employees ride bikes, ride the bus, or walk to work?

1

300

2

450

3

325

4

375

33

Multiple Choice

Question image

What is the difference in the number of people who owned a Wii and the number who owned a Gameboy?

1

4

2

7

3

3

4

2

34

Multiple Choice

Question image

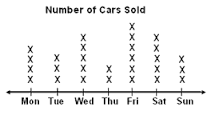
Which month had the greatest number of books read?

1

November

2

December

3

January

4

February

35

Multiple Choice

Question image

Which month had the fewest books read?

1

January

2

February

3

March

4

April

36

Multiple Choice

Question image
How many cars were sold on Saturday and Sunday?
1
5
2
3
3
8
4
10

37

Multiple Choice

Question image
What is the difference between the highest score and the lowest score on the test?
1
15
2
100
3
6
4
10

38

Multiple Choice

Question image
Which day had more minutes of homework?
1
Wednesday
2
Thursday
3
Friday
4
Ms. Jones

39

Multiple Choice

Question image
How many more people have purple for a favorite color than red?
1
3
2
5
3
7
4
9

40

Multiple Choice

Question image
How many people watched between 6 and 10 hours of TV last week?
1
31
2
22
3
15
4
35

Categorical vs. Numerical Data

What is the difference? 

media

Show answer

Auto Play

Slide 1 / 40

SLIDE