
Scatterplot, Correlation/Line of Best Fit
Presentation
•
Mathematics
•
•
Easy
+6
Standards-aligned
Colleen Skerry
Used 9+ times
FREE Resource
12 Slides • 32 Questions
1

2

3

4
Multiple Choice

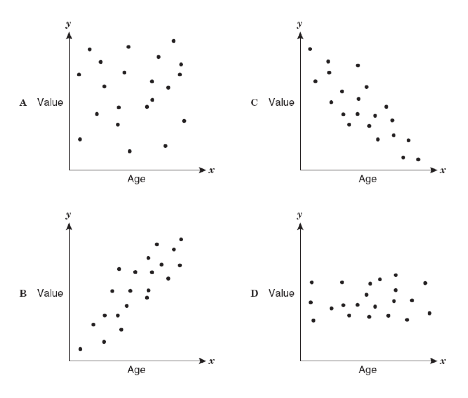
Can you guess the correlation?
5
Multiple Choice

Can you guess the correlation?
6
Multiple Choice

Can you guess the correlation?
7
Multiple Choice

Guess the correlation between the variables:
8
Multiple Choice

Guess the correlation between the variables:
9
Multiple Choice

Guess the correlation between the variables:
10
Multiple Choice

Guess the correlation between the variables:
11
Multiple Choice

Guess the correlation between the variables:
12
Multiple Choice

Guess the correlation between the variables:
13
Multiple Choice

Guess the correlation between the variables:
14

15

16
Multiple Choice

What is the correlation between length of running start and distance of jump?
17
Multiple Choice

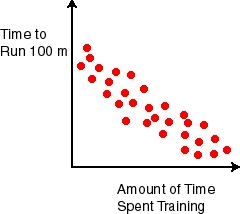
What type of association does this scatter plot show?
18
Multiple Choice
19
Multiple Choice
20
Multiple Choice

21

22

23

24

25

26

27

28
Multiple Choice

Determine the correlation.
29
Multiple Choice

30
Multiple Choice

Determine the correlation.
31
Multiple Choice

Does the plot show a positive trend, negative trend, or no trend?
32
Multiple Choice

What type of relationship does this scatter plot show?
33
Multiple Choice
What type of correlation does this scatter plot show?
34
Multiple Choice
35
Multiple Choice
36
Multiple Choice
37
Multiple Choice
38
Multiple Choice
39
Multiple Choice

40
Multiple Choice
41
Multiple Choice
42
Multiple Choice
43
Multiple Choice

44
Multiple Choice

Show answer
Auto Play
Slide 1 / 44
SLIDE
