
Key Features
Presentation
•
Mathematics
•
9th - 12th Grade
•
Medium
+1
Standards-aligned

Christopher Barrick
Used 17+ times
FREE Resource
17 Slides • 10 Questions
1
Key Features of ALL Functions
2
TEKS
TEKS A.3C: graph linear functions on the coordinate plane and identify key features, including x‐intercept, y‐intercept, zeros, and slope, in mathematical and real‐world problems
TEKS A.7A: graph quadratic functions on the coordinate plane and use the graph to identify key attributes, if possible, including x‐intercept, y‐intercept, zeros, maximum value, minimum values, vertex, and the equation of the axis of symmetry
TEKS A.9C: write exponential functions in the form f(x) = abx (where b is a rational number) to describe problems arising from mathematical and real‐world situations, including growth and decay
3
Linear
X-intercepts
Y-Intercepts
Slope
Graphing
4
Where it crosses the y-axis
Also known as INTIAL AMOUNT or STARTING VALUE
X=0
Y-intercepts
Where it crosses the x-axis
Also known as a ROOTS, ZERO, or SOLUTION
Y=0
X-intercepts
Intercepts
5
Multiple Choice

THINK-PAIR-SHARE
What is the x-intercept shown on the graph?
6
Multiple Choice

THINK-PAIR-SHARE
What is the y-intercept shown on the graph?
7
Slope
8

With your partner
Find the slope of the graph.
Write it on your WHITEBOARD when the timer goes off.
TABLE TALK
WHITEBOARD
9
Multiple Choice

THINK-PAIR-SHARE
Find the slope:
10
Graphing
You only need 2 points! Let the computer do the rest.
Today we will focus on using our shortcuts for STANDARD form to find the x-intercept and y-intercept.
11
Y-intercept
X-intercept
Ax+By=C
12
Y-intercept
X-intercept
2x+3y=12
13
Graphing
Now lets use the x-intercept and y-intercept to graph
2x+3y=12
14
Graphing
TABLE TALK
With your partner
Use the shortcuts for the x & y intercepts.
Then graph the line.
2x+5y=10
15
Quadratic
X-intercepts
Y-Intercepts
Vertex
Axis of symmetry
Maximum/Minimum
Graphing
16
Where it crosses the y-axis
Also known as INTIAL AMOUNT or STARTING VALUE
X=0
Y-intercepts
Where it crosses the x-axis
Also known as a ROOTS, ZERO, or SOLUTION
Y=0
X-intercepts
Intercepts
17

What are the zeros of the quadratic functions shown?
Work with your partner.
Write the answer down on the whiteboard when the timer goes off.
THINK-PAIR-SHARE
WHITEBOARD
18
In Standard form, your a value will be POSITIVE.
Your graph will look like a HAPPY FACE.
Minimum
In Standard form, your a value will be NEGATIVE.
Your graph will look like a SAD FACE.
Maximum
Vertex: the top most or bottom most point
19
Multiple Choice

THINK-PAIR-SHARE
Does this graph have a minimum or maximum? What point?
minimum at (-3, -5)
minimum at (3, 5)
maximum at (-3, -5)
maximum at (3, 5)
20
Axis of Symmetry
21
Multiple Choice
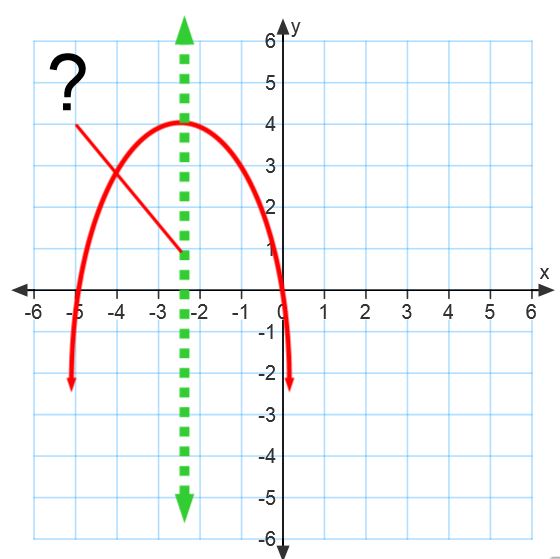
THINK-PAIR-SHARE
What is the green dashed line called?
22
Multiple Choice
THINK-PAIR-SHARE
A parabola has a vertex at (-3,2).
Where is the axis of symmetry?
23
Multiple Choice

THINK-PAIR-SHARE
What is the equation for axis of symmetry?
24
Writing Exponential Functions
a is your INTIAL VALUE or STARTING AMOUNT.
b is your GROWTH or DECAY rate
Growth will be MORE than 1
Decay will be LESS than 1 but MORE than 0.
x is ALWAYS your exponent
25
Identify the a and b value.
Write the equation.
Researchers studied the population of a town over time and modeled the data using an exponential function.
The initial estimated population was 48,000.
After the first year, the population of the town was 50,400.
26
INK-PAIR-SHARE & WHITEBOARD
Identify the a and b value.
Write the equation.
A sample of a substance with an initial mass of 963 grams is decaying at a rate of 27% per hour.
27
Multiple Choice
THINK-PAIR-SHARE
Write an exponential function to model the situation. You invest $1500. Your investment increases at a rate of 3.5%.
f(x) = 1500(0.965)x
f(x) = 1500(1.035)x
f(x) = 1500(.035)x
f(x) = 1500(1.965)x
Key Features of ALL Functions
Show answer
Auto Play
Slide 1 / 27
SLIDE
Similar Resources on Wayground

20 questions
Function or Not?
Presentation
•
9th - 12th Grade
23 questions
Mutually Exclusive Events and Addition Rule
Presentation
•
9th - 12th Grade
20 questions
Adding and Subtracting Polynomials
Presentation
•
9th - 12th Grade
18 questions
Graphing Systems of Linear Inequalities
Presentation
•
9th - 12th Grade
20 questions
Converting forms of Circles Lesson
Presentation
•
9th - 12th Grade
24 questions
Solving Quadratic Equations by Factoring
Presentation
•
9th - 12th Grade
20 questions
Interval Notation
Presentation
•
9th - 12th Grade
21 questions
Systems of Equations Word Problems
Presentation
•
9th - 12th Grade
Popular Resources on Wayground
24 questions
PBIS-HGMS Day 10
Quiz
•
6th - 8th Grade
10 questions
HCS SCI 03 Summer School Review 3
Quiz
•
3rd Grade
11 questions
Home Scope
Quiz
•
7th - 8th Grade
15 questions
HCS SCI 05 Summer School Assessment 3 Review
Quiz
•
5th Grade
35 questions
Lufkin Road Middle School Student Handbook & Policies Assessment
Quiz
•
7th Grade
18 questions
Geo 11.3 Area of Circles and Sectors
Quiz
•
9th - 11th Grade