
Unit3B Review
Presentation
•
Mathematics
•
7th Grade
•
Practice Problem
•
Hard
+5
Standards-aligned
Shelby Hinricksen
Used 8+ times
FREE Resource
5 Slides • 20 Questions
1
Unit 3B Review: Populations, Samples, and Drawing Inferences
2
Unit 3 Vocabulary to Remember
Population
3
Multiple Choice
A ______ is the entire set of objects from which data might be collected
sample
population
numerical summary
statistic
4
Multiple Choice
A _______ is a subset of the population.
population
numerical value
statistic
sample
5
Multiple Choice
True or False: All samples lead to a good prediction about the entire population.
True
False
6
Multiple Choice
A student wants to know which type of of pizza high school students perfer. Which of the following options is a good, representative sample of the population?
Asking all the 10th graders in the school
Asking 20 students from each grade level
Asking the school principal which type of pizza he perfers
Asking the students who walk to school
7
Multiple Choice
A beverage company wants to see if people in the United States like their new logo. Which of the following represents the best choice for a sample?
a collection of shoppers from different states
all the people living in the United States
a selection of logo artists
2,000 children from ages 5-13
8
Multiple Choice
9
Multiple Choice
What is the range of the data set?
45
7
17
9.5
10
Multiple Choice
How many students scored over 80%?
26
20
17
11
11
Multiple Choice
How many students got 95% or higher?
5
4
1
9
12
Multiple Choice
Find the mean of the dot plot
5
9
1.5
10
13
Multiple Choice
What is the longest amount of hours slept by a 6th grader reported?
10
13
2
11
14
Multiple Choice
15
Mean Absolute Deviation
The average distance between the data values and the mean.
Find the mean, then find the distance between the mean and each data value.
16
Example: 10,12,18,11,19
10+12+18+11+19=70 70/5=14
14-10=4
14-12=2
18-14=4
14-11=3
19-14=5
4+2+4+3+5=18. 18/5=3.6
17
Multiple Choice
What is Mean Absolute Deviation?
The mean of the data
The absolute value of the mean
The variation of data values around the mode
The average distance between the data values and the mean
18
Multiple Choice
19
Multiple Choice
58, 38, 54, 48, 26, 36
20
Inter-Quartile Range is the distance between the lower and upper quartile.
(50% of data is within this range)
Inter-Quartile Range (IQR)
How to Calculate IQR:
You must find the difference between quartile 2 and quartile 1.
Q2 - Q1
(Q1 is the middle of the lower half, Q2 is the middle of the upper half)
Confused? Watch this video! https://youtu.be/9jYqZS142mg
21
Multiple Choice
22
Multiple Choice
23
Multiple Choice
24
Multiple Choice
25
Multiple Choice
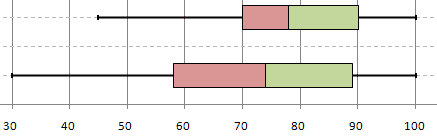
Which car club has the higher IQR and by how much?
The Cruisers by 6
The Car Hops by 4
The Cruisers by 2
The Car Hops by 2
Unit 3B Review: Populations, Samples, and Drawing Inferences
Show answer
Auto Play
Slide 1 / 25
SLIDE
Similar Resources on Wayground
20 questions
Writing One Step Equations
Presentation
•
7th Grade
19 questions
Triangles
Presentation
•
7th Grade
19 questions
Adding Integers
Presentation
•
7th Grade
18 questions
ABSOLUTE VALUE AND INTEGERS
Presentation
•
7th Grade
21 questions
Mean, Median, Mode, and Range
Presentation
•
7th Grade
20 questions
7th review part 2 Probability models Compound events
Presentation
•
7th Grade
18 questions
D7 Activity: Adding + Subtracting Integers
Presentation
•
7th Grade
21 questions
SA 1.3 Angle Relationships
Presentation
•
7th Grade
Popular Resources on Wayground
20 questions
STAAR Review Quiz #3
Quiz
•
8th Grade
20 questions
Equivalent Fractions
Quiz
•
3rd Grade
6 questions
Marshmallow Farm Quiz
Quiz
•
2nd - 5th Grade
20 questions
Main Idea and Details
Quiz
•
5th Grade
20 questions
Context Clues
Quiz
•
6th Grade
20 questions
Inferences
Quiz
•
4th Grade
19 questions
Classifying Quadrilaterals
Quiz
•
3rd Grade
12 questions
What makes Nebraska's government unique?
Quiz
•
4th - 5th Grade
Discover more resources for Mathematics
10 questions
Box Plots
Quiz
•
6th - 7th Grade
14 questions
Volume of rectangular prisms
Quiz
•
7th Grade
22 questions
Simple Probability
Quiz
•
7th Grade
20 questions
Graphing Inequalities on a Number Line
Quiz
•
6th - 9th Grade
15 questions
Simple Probability
Quiz
•
7th Grade
10 questions
Pythagorean Theorem and its Converse
Quiz
•
7th - 9th Grade
20 questions
Theoretical and Experimental Probability
Quiz
•
7th Grade
12 questions
Simple Probability
Quiz
•
7th Grade