
Empirical
Presentation
•
Mathematics
•
10th Grade
•
Medium
+3
Standards-aligned

Stephanie Luckett
Used 1+ times
FREE Resource
0 Slides • 38 Questions
1
Multiple Choice
2
Multiple Choice
3
Multiple Choice
4
Multiple Choice
5
Multiple Choice
6
Multiple Choice
7
Multiple Choice
8
Multiple Choice
9
Multiple Choice
10
Multiple Choice
11
Multiple Choice
12
Multiple Choice

13
Fill in the Blank
14
Fill in the Blank
15
Multiple Choice

What type of distribution is pictured?
16
Multiple Choice
17
Multiple Choice
18
Multiple Choice
19
Multiple Choice
20
Multiple Choice
21
Multiple Choice
22
Multiple Choice

The distribution above is normal. What percent lies below the curve?
23
Multiple Choice

24
Multiple Choice

The distribution above is normal. What percent lies between ±3 standard deviations?
25
Multiple Choice
26
Multiple Choice
27
Multiple Choice
28
Multiple Choice
29
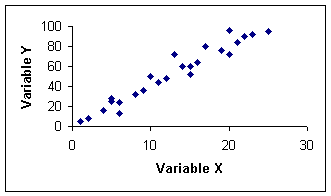
Multiple Choice
What type of correlation does this scatter plot show?
30
Multiple Choice
31
Multiple Choice

32
Multiple Choice
33
Multiple Choice

What is the percentage of data that falls within one standard deviation of the mean?
34
Multiple Choice

What is the percentage of data that falls within two standard deviations of the mean?
35
Multiple Choice

What percent of people within 2 standard deviations of the mean?
36
Multiple Choice
What percent of people within 3 standard deviations of the mean?
37
Multiple Choice
38
Multiple Choice
Show answer
Auto Play
Slide 1 / 38
MULTIPLE CHOICE
