
Line of best fit - Scatter Plots
Presentation
•
Mathematics
•
9th - 12th Grade
•
Easy
•
CCSS
HSS.ID.B.5, 8.EE.B.5, HSS.ID.C.8
+4
Standards-aligned

Amy Cooper
Used 1+ times
FREE Resource
7 Slides • 16 Questions
1

2

3
Multiple Choice

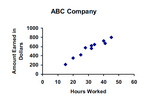
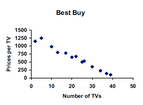
What type of association does this graph have?
4

5
Multiple Choice

Which scatter plot shows a linear relationship between x and y?
6

7
Multiple Choice

What are the coordinates of the outlier?
8

9
Multiple Choice

Which of the following lines represents the line of best fit for the scatter plot?
10
Multiple Choice

Which of the following lines represents the line of best fit for the scatter plot?
11
Multiple Choice

Determine the correlation.
12
Multiple Choice

Determine the correlation.
13
Multiple Choice

The scatter plot shows the relationship between the number of chapters and the total number of pages for several books. Use the trend line to predict how many chapters would be in a book with 180 pages.
14
Drag and Drop

Based on the Desmos shown, what is the equation for the line of best fit?
y =
y =
x +
15
Drag and Drop
The data in the graph shown represents your grade point average (GPA) based on how many semesters you've been in high school. X represents the number of semesters completed, y represents your GPA. Isaac wants to use this to predict his GPA at the end of his freshman year (2 semesters)
Fill in the blanks based on what he would need to type into a calculator to make this prediction:
Fill in the blanks based on what he would need to type into a calculator to make this prediction:
*
+
16

17

18
Multiple Choice

Describe the correlation in the graph shown.
19
Multiple Choice
Estimate the correlation coefficient for this scatterplot.
20
Multiple Choice
Estimate the correlation coefficient for this scatterplot.
21
Multiple Choice
22
Multiple Choice

About how many points would we expect if Vasu played 40 minutes?
23
Poll
Show answer
Auto Play
Slide 1 / 23
SLIDE
