Search Header Logo
COMPLETE IELTS 6-7.5 UNIT 3 WRITING TASK 1

COMPLETE IELTS 6-7.5 UNIT 3 WRITING TASK 1

Assessment

Presentation

English

9th - 12th Grade

Practice Problem

Medium

Created by

Ánh Ngọc

Used 1+ times

FREE Resource

3 Slides • 24 Questions

1

COMPLETE IETLS 6-7.5
UNIT 3 WRITING TASK 1

2

Draw

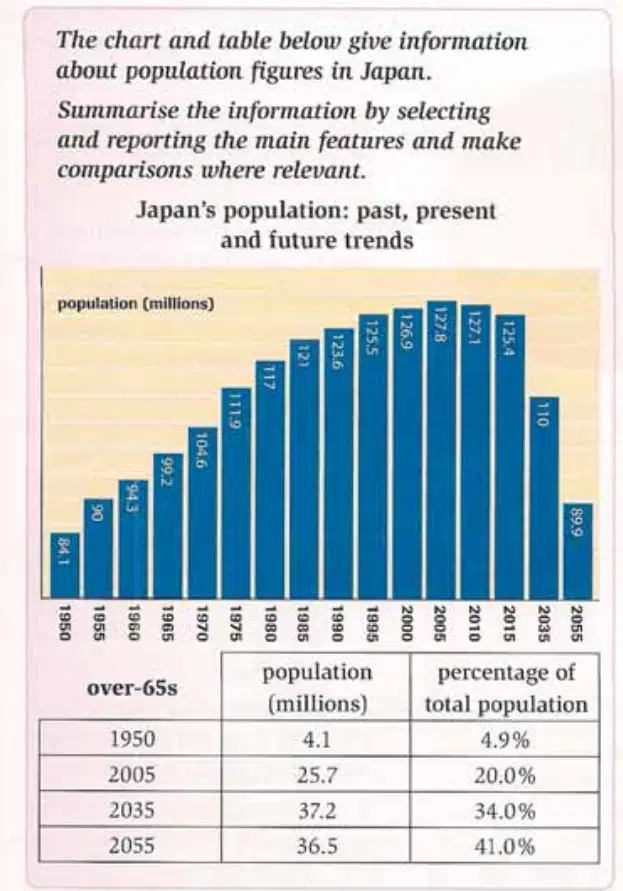
The table and chart provide information regarding population growth and the proportion of the population over 65 over a 100-year period iNapan.

According to the information japan's general population figures in 1950 were very different from those in 2005, and future predictions show even greater differences. In 1950, the number of people was just over 84 million and only 4.9 percent (4.1 million) of these people were above the age of 65. By 2005, the percentage of older people had risen considerably to 20 percent while me overall population had shown a parallel increase to nearly 128 million. However, total population figures peaked in 2005 and it is expected that the number of people living in Japan will fall substantially over the next 50 years to a little below 90 million. In spite of this fall, the rise in the ageing population will continue. and at a faster rate so that by 2055, 41 percent (47,5 million) Japa nese people will be over 65. These statistics show contrasting trends injapans demographics that will result in fewer citizens, but greater numbers of elderly people.

3

Fill in the Blanks

Type answer...

4

Open Ended

What was the purpose of the first sentence in paragraph 2:

According to the information japan's general population figures in 1950 were very different from those in 2005, and future predictions show even greater differences.

5

Fill in the Blanks

Type answer...

6

Fill in the Blanks

Type answer...

7

Open Ended

Question image

In 1950, the number of people was just over ................. and only 4.9 percent ...........................

8

Open Ended

Question image

By 2005, the percentage of older people ................................. while me overall population ..........................

9

Open Ended

Question image

However, total population figures peaked in 2005 and it is expected that the number of people living in Japan will .................................

10

Open Ended

Question image

In spite of this fall, the rise in the ageing population will continue and at a faster rate so that by 2055, ................

11

Fill in the Blanks

Type answer...

12

Fill in the Blanks

Type answer...

13

Fill in the Blanks

Type answer...

14

Fill in the Blanks

Type answer...

15

Fill in the Blanks

Type answer...

16

Fill in the Blanks

Type answer...

17

Multiple Choice

It is important to control the ................ of sunshine children are exposed to.

1

quantity

2

amount

3

both

18

Multiple Choice

To discourage driving certain .................. of the public transport system should be improved.

1

aspects

2

qualities

3

both

19

Multiple Choice

The ....................... of smokers to non-smokers is greater in some parts of the world than in others.

1

proportion

2

rate

3

both

20

Multiple Choice

The ................ of workers doing shifts is very high.

1

quantity

2

number

3

both

21

Multiple Choice

The water ................... were highest at midday.

1

levels

2

percentages

3

both

22

Multiple Choice

This solution will reduce the unemployment ..............

1

rate

2

number

3

both

23

Open Ended

Question image

amount, aspect, incidence, level, number, proportion, quantity, levels, rate, type,

24

media

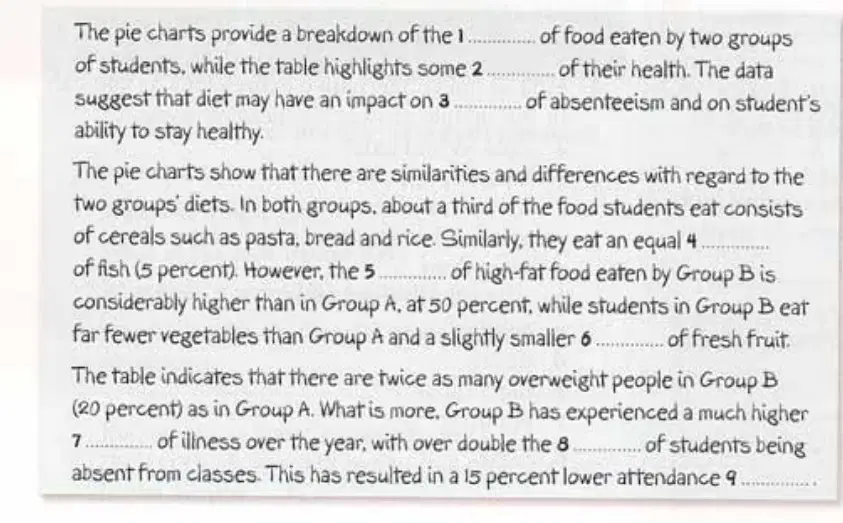
The pie charts provide a breakdown of the (1)types of food eaten by two groups of students while the table highlights some (2) aspects of their health.
The data suggest that diet may have an impact on (3) levels of absenteeism and on student's ability to stay healthy. The pie charts show that there are similarities and differences with regard to the two groups diets. In both groups, about a third of the food students eat consists of cereals such as pasta, bread and rice. Similarly, they eat an equal' (4) proportion/amount of fish (5 percent). However, the (5) proportion/amountof high-fat food eaten by Group B is considerably higher than in Group A at 50 percent. while students in Group B eat far fewer vegetables than Group A and a slightly smaller (6) proportion/amount of fresh fruit.

The table indicates that there are twice as many overweight people in Group B (20 percent) as in Group A. What is more, Group B has experienced a much higher (7) level/incidence/rate of illness over the year with over double the (8) number of students being absent from classes. This has resulted in a 15 percent lower attendance (9) rate.

25

Open Ended

Write the outline based on the following writing

In both groups, about a third of the food students eat consists of cereals such as pasta, bread and rice. Similarly, they eat an equal' (4) proportion/amount of fish (5 percent). However, the (5) proportion/amountof high-fat food eaten by Group B is considerably higher than in Group A at 50 percent. while students in Group B eat far fewer vegetables than Group A and a slightly smaller (6) proportion/amount of fresh fruit.

26

Open Ended

Write the main body paragraph based on the following outline:

Sentence 1: both G: 1/3 F-> Ss eat consists of C
Sentence 2: eat an equal % of Fish
Sentence 3: Amount _> High-fat F -> GB: consi. higher GA: 50%; GB" fewer Veg >GA. GA: smaller pro -> fresh food

27

media

In both groups, about a third of the food students eat consists of cereals such as pasta, bread and rice. Similarly, they eat an equal' (4) proportion/amount of fish (5 percent). However, the (5) proportion/amount of high-fat food eaten by Group B is considerably higher than in Group A at 50 percent. While students in Group B eat far fewer vegetables than Group A and a slightly smaller (6) proportion/amount of fresh fruit.
Sentence 1: both G: 1/3 F-> Ss eat consists of C
Sentence 2: eat an equal % of Fish
Sentence 3: Amount _> High-fat F -> GB: consi. higher GA: 50%; GB" fewer Veg >GA. GA: smaller pro -> fresh food

COMPLETE IETLS 6-7.5
UNIT 3 WRITING TASK 1

Show answer

Auto Play

Slide 1 / 27

SLIDE