
Comparative Inferences
Presentation
•
Mathematics
•
6th - 8th Grade
•
Easy
+14
Standards-aligned
Shasta L Long
Used 21+ times
FREE Resource
5 Slides • 27 Questions
1
Comparative Inferences
2
Multiple Choice
Valid inferences are based on data and are most likely true.
TRUE
FALSE
3
Multiple Choice
A ___ is the entire group of objects or individuals being studied.
sample
population
random sample
quartile
4
Multiple Choice
A ___ is a part of a group being surveyed.
sample
population
random s
quartile
5
Multiple Select
In order to collect good data, the sample needs to be unbiased.
To have an unbiased sample, it should be ___ and ___.
Select two answer choices.
randomly selected
rationalized through data
representative of the population
reflective of the needs of the survey
6
Multiple Choice
Several students were surveyed about their favorite drinks.
22 Fanta, 34 Pepsi, 20 Coke, and 29 Grape.
Predict how many students will like Coke if 500 students are surveyed?
95
7
Multiple Choice
Bob asked 8 band members and found that 3 members play more than one instrument.
Use his results to predict how many of Oak School's 152 band members play more than one instrument.
8
Multiple Choice
The TV station wants to get the opinion of viewers on the look of a new game-show set.
The station's staff calls random people in the phone book. Is this biased or unbiased?
9
Multiple Choice
10
Multiple Choice
The mean is found by ___ all of the numbers and then ___ by the number of items.
adding
subtracting
adding
multiplying
dividing
adding
adding
dividing
11
Multiple Choice
Find the mean of these numbers.
5, 11, 2, 12, 4, 2
12
Multiple Choice
Lizzy had test scores of 72, 94, 108, 60.
What is the range of her test scores?
13
Interquartile Range (IQR)
14
Multiple Choice
15
Median
When given data, the median is found in the middle AFTER the values are ordered from least to greatest.
On a box-and-whisker plot, the median is the line inside the box.
16
Multiple Choice
When finding the median, what do you do if there are two numbers in the middle of the set of data?
Add them together and divide by 2.
Write them both as the answer.
Give up.
Pick one.
17
Multiple Choice
Find the median of the set of numbers.
60, 58, 52, 48, 60, 67
58
59
60
118
18
Multiple Choice
Find the median.
19
Multiple Choice
Find the median.
3, 5, 7, 4, 3, 1
There isn't one.
20
Measures of Variability
RANGE & IQR
Measures of variability describe the spread of the data.
If the range/IQR of the data is small, the variability is low.
If the range/IQR of the data is large, the variability is high.
21
Measures of Variability
RANGE & IQR
Measures of variability also describe the consistency in the data.
If the range/IQR of the data is small, the consistency is high.
If the range/IQR of the data is large, the consistency is low.
22
Multiple Select
What are two measures of variability & consistency?
IQR
mean
median
mode
range
23
Multiple Choice
Which class was more consistent in their Algebra scores?
24
Multiple Choice
They have equal variability.
25
Multiple Choice
26
Multiple Choice
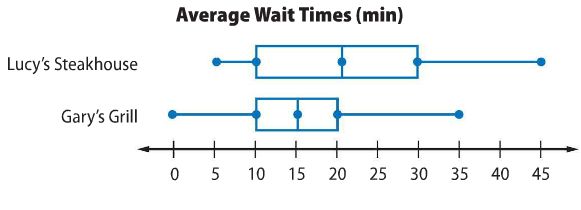
Based on measures of center, which restaurant has a longer wait time?
Lucy's Steakhouse
Gary's Grill
The wait times are the same.
27
Multiple Choice
Based on measures of center, which club attends more car shows?
Cruisers
Car Hops
28
Multiple Choice
Which club has greater variability?
Car Hops
The box is shorter.
Cruisers
IQR = 6
Car Hops
IQR = 4
Cruisers
IQR = 13
29
Multiple Choice
What inference can you make about the test scores?
Based on the median, Class 1 has better scores than Class 2.
Based on the median, Class 2 has better scores than Class 1.
Based on the IQR, Class 1 has better scores than Class 2.
Based on the IQR, Class 2 has better scores than Class 1.
30
Multiple Choice
What inference can you make about the test scores?
Based on the range, Class 1 is less consistent than Class 2.
Based on the IQR, Class 2 is more consistent than Class 1.
Based on the IQR, Class 1 is more consistent than Class 2.
Based on the range and IQR, the classes are equally consistent.
31
Math Response
32
Multiple Choice
Paul compares the high temperatures in City 1 and City 2 for one week. In City 1, the range in temperature is 10°F and the IQR is 5°F. In City 2, the range in temperature is 20°F and the IQR is 5°F.
What might you conclude about the weather pattern in each city based on the ranges and IQRs?
The weather pattern in City 1 is more consistent than the weather pattern in City 2.
The weather patterns in City1 and City 2 are equally consistent.
The weather pattern in City 2 is more consistent than the weather pattern in City 1.
The range and IQR do not provide enough information to make a conclusion.
Comparative Inferences
Show answer
Auto Play
Slide 1 / 32
SLIDE
Similar Resources on Wayground
25 questions
4/25 Random Sampling
Presentation
•
7th Grade
26 questions
Plate Tectonics Review Lesson
Presentation
•
6th - 8th Grade
27 questions
Classifying Numbers
Presentation
•
6th - 8th Grade
25 questions
Functions: Evaluating & Graphing
Presentation
•
6th - 8th Grade
25 questions
Solving Equations Using Distributive Property
Presentation
•
7th - 8th Grade
23 questions
Area of Parallelograms and Triangles
Presentation
•
6th - 7th Grade
25 questions
Scale Factor and Scale Drawings
Presentation
•
6th - 8th Grade
25 questions
Independent Compound Probability Lesson
Presentation
•
7th Grade
Popular Resources on Wayground
10 questions
5.P.1.3 Distance/Time Graphs
Quiz
•
5th Grade
10 questions
Fire Drill
Quiz
•
2nd - 5th Grade
20 questions
Equivalent Fractions
Quiz
•
3rd Grade
22 questions
School Wide Vocab Group 1 Master
Quiz
•
6th - 8th Grade
20 questions
Main Idea and Details
Quiz
•
5th Grade
20 questions
Context Clues
Quiz
•
6th Grade
20 questions
Inferences
Quiz
•
4th Grade
12 questions
What makes Nebraska's government unique?
Quiz
•
4th - 5th Grade
Discover more resources for Mathematics
10 questions
Box Plots
Quiz
•
6th - 7th Grade
14 questions
Volume of rectangular prisms
Quiz
•
7th Grade
15 questions
Pythagorean Theorem Word Problems Quizizz
Quiz
•
8th Grade
22 questions
Simple Probability
Quiz
•
7th Grade
10 questions
U7L3 Power of Powers of 10
Quiz
•
8th Grade
20 questions
Graphing Inequalities on a Number Line
Quiz
•
6th - 9th Grade
20 questions
Box and Whisker Plots
Quiz
•
6th Grade
20 questions
Ratios/Rates and Unit Rates
Quiz
•
6th Grade