Search Header Logo
Lesson 06: The Slope of a Fitted Line | Unit 6: Associations in Data

Lesson 06: The Slope of a Fitted Line | Unit 6: Associations in Data

Assessment

Presentation

Mathematics

8th Grade

Hard

CCSS
6.NS.B.3, HSF.LE.B.5, 8.EE.B.5

+1

Standards-aligned

Created by

Wayground Content

Used 1+ times

FREE Resource

34 Slides • 9 Questions

1

media

2

media

3

media

4

media

5

media

6

media

7

media

8

media

9

media

10

media

11

media

12

media

13

media

14

media

15

media

16

media

17

media

18

media

19

media

20

media

21

media

22

media

23

media

24

media

25

media

26

media

27

media

28

media

29

media

30

media

31

media

32

media

33

media

34

media

35

Multiple Choice

Question image

Which of these statements is true about the data in the scatter plot?

1

As xx increases, yy tends to increase.

2

As xx increases, yy tends to decrease.

3

As xx increases, yy tends to stay unchanged.

4

xx and yy are unrelated.

36

Multiple Choice

Question image

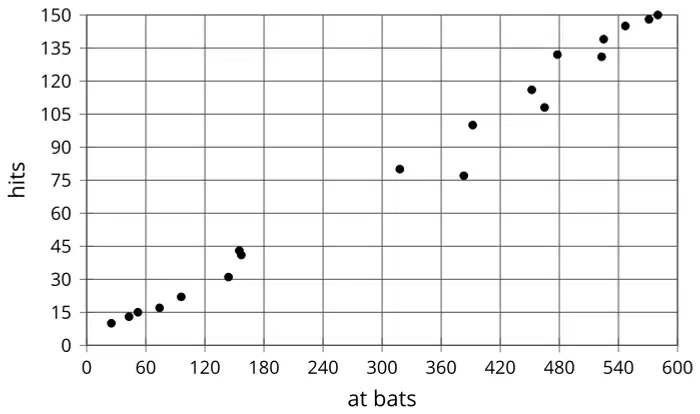
What does the scatter plot suggest about the relationship between the number of at bats and the number of hits?

1
There is a positive correlation between the number of at bats and the number of hits.
2
There is no correlation between the number of at bats and the number of hits.
3
The number of hits decreases as the number of at bats increases.
4
There is a negative correlation between the number of at bats and the number of hits.

37

Multiple Choice

Question image

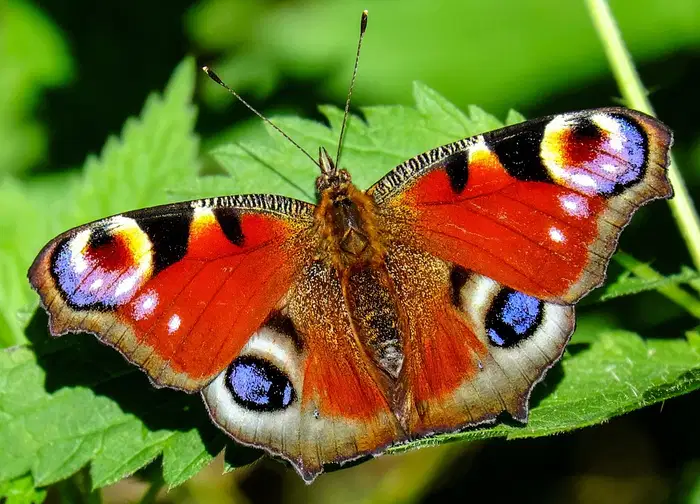
The linear model for some butterfly data is given by the equation y=0.238x+4.642y = 0.238x + 4.642 . Which of the following best describes the slope of the model?

1

For every 1 mm the wingspan increases, the length of the butterfly increases 0.238 mm.

2

For every 1 mm the wingspan increases, the length of the butterfly increases 4.642 mm.

3

For every 1 mm the length of the butterfly increases, the wingspan increases 0.238 mm.

4

For every 1 mm the length of the butterfly increases, the wingspan increases 4.642 mm.

38

Multiple Choice

Question image

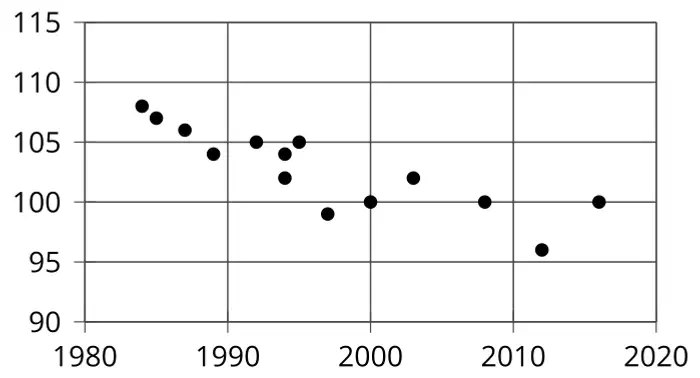
Using the data in the scatter plot, what can you tell about the slope of a good model for this data?

1

The slope is positive.

2

The slope is zero.

3

The slope is negative.

4

There is no association.

39

Multiple Choice

Question image

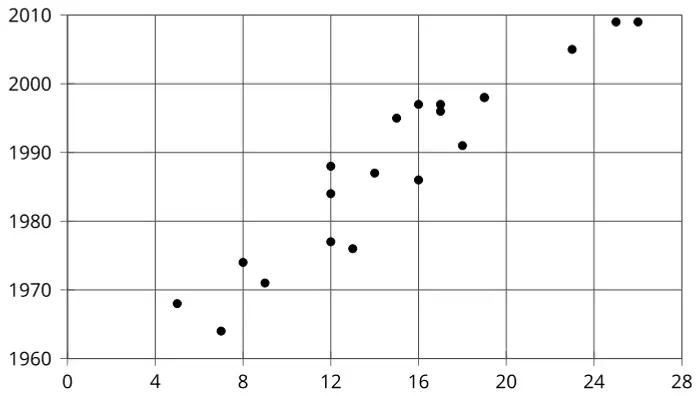
Using the data in the scatter plot, what is a reasonable slope of a model that fits this data?

1

-2.5

2

-1

3

1

4

2.5

40

Multiple Choice

Question image

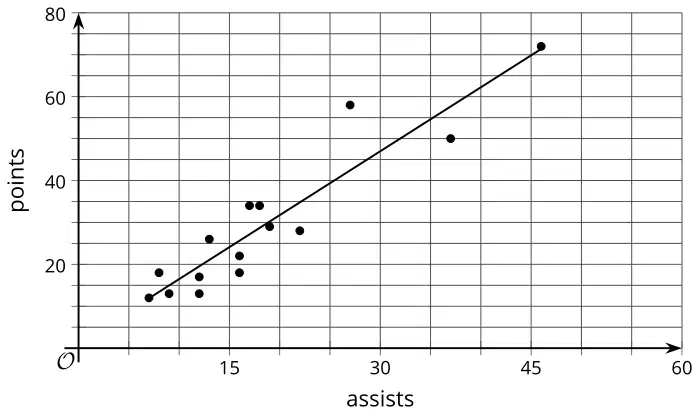
What does the slope mean in this situation? Context: Here is a scatter plot that shows the number of assists and points for a group of hockey players. The model, represented by y=1.5x+1.2y = 1.5 x + 1.2 , is graphed with the scatter plot.

1
The slope means that for each assist, the player scores 1.5 additional points.
2
The slope means that the total points are equal to the number of assists.
3
The slope shows that the player scores 1.5 points for every assist they make.
4
The slope indicates that for every point, the player makes 1.5 assists.

41

Multiple Choice

Question image

Based on the model, how many points will a player have if he has 30 assists? Context: Here is a scatter plot that shows the number of assists and points for a group of hockey players. The model, represented by y=1.5x+1.2y = 1.5 x + 1.2 , is graphed with the scatter plot.

1
52.8
2
46.2
3
30.5
4
39.0

42

Multiple Choice

Question image

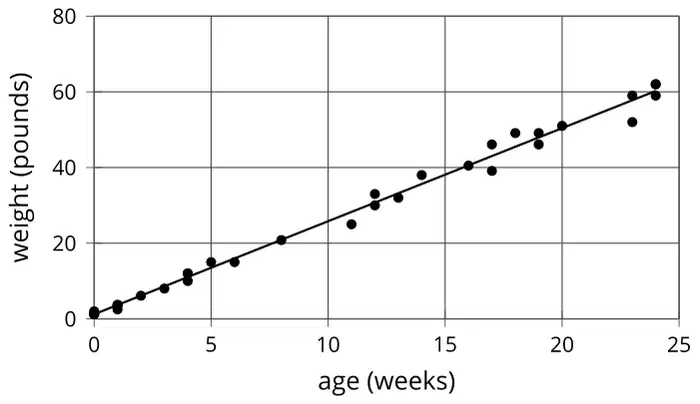
Here is a scatter plot of weight vs. age for different Dobermanns. The model represented by y=2.45x+1.22y = 2.45x + 1.22 is graphed with the scatter plot. Here, xx represents age in weeks, and yy represents weight in pounds. What is the slope and what does it mean in this situation?

1
The slope is 2.45, indicating weight decreases by 2.45 pounds per week.
2
The slope is 1.22, indicating weight increases by 1.22 pounds per week.
3
The slope is 2.45, indicating weight increases by 2.45 pounds per week.
4
The slope is 3.00, indicating weight increases by 3.00 pounds per week.

43

Multiple Choice

Question image

Based on the model y=2.45x+1.22y = 2.45x + 1.22 , how heavy would you expect a newborn Dobermann to be?

1
5.00 pounds
2
10.50 pounds
3
15.75 pounds
4
1.22 pounds
media

Show answer

Auto Play

Slide 1 / 43

SLIDE