

Filtering and Cleaning Data

Presentation
•
Computers
•
12th Grade
•
Practice Problem
•
Easy

Katherine Valenti
Used 3+ times
FREE Resource
20 Slides • 4 Questions
1


Unit 5 - Lesson 3
Filtering and Cleaning Data
Computer Science Principles
2

3

Imagine you have used a survey to collect information from students.
All of that data is now stored in a table. You are excited to dig into the data and see what you can learn. Let's go!
???
Unit 5 Lesson 3 - Warm Up
Collect or
Choose Data
4

5

Do This:
● Navigate to Level 1 on Code Studio
● Open the data tab
● Familiarize yourself with the imported table
● Open the Data Visualizer
● Make charts:
○ Average Hours of Sleep
○ Favorite Subject
Unit 5 Lesson 3 - Activity
6
Open Ended
What problems came up when trying to create these charts?
What problems do you see in the data?
7
Cleaning Data
4 and "four" are charted as different values, leading to confusion in our visualizations
8

Unit 5 Lesson 3 - Activity
Cleaning Data
When does data need to be cleaned?
●Data is incomplete
●Data is invalid
●Multiple tables are combined into one
What leads to "messy" data?
●Users enter in different types of data ("two", 2)
●Users use different abbreviations to represent the same information ("February", "Feb", "Febr")
●Data may have different spellings ("color", "colour") or inconsistent capitalization ("spring", "Spring")
9

Unit 5 Lesson 3 - Activity
Cleaning Data
Goal: To clean data without changing meaning
Method:
● Look through the data manually. Find and fix messy data.
●Use a program to find and fix messy data.
We will use the manual method today.
10
Unit 5 Lesson 3 - Activity
Do This:
●Clean the Student Info table
●Look for:
○Different types of data ("two", 2)
○Different abbreviations to represent the
same information ("February", "Feb", "Febr")
○Different spellings ("color", "colour")
○Inconsistent capitalization ("spring", "Spring")
●Manually update cells with messy data so they are consistent with other cells, while not changing the meaning of the data.
* Note: Not all of these are present in this dataset
To edit a cell, click on the edit button at the end of the row. Click save after you've finished.
11

Unit 5 Lesson 3 - Activity
Do This:
● Make charts:
○ Average amount of sleep
○ Favorite class
12
Open Ended
What if I only wanted to look at a subset of my data? How could I do this? (For example: I only want to investigate dogs with long lifespans.)
13
Filtering Data
Deleting unwanted rows or creating new tables could be an option
What would you do if you wanted to look at several different subsets in the same data?
Is it reasonable to create a new table for each subset?
14
Unit 5 Lesson 3 - Activity
Filtering Data
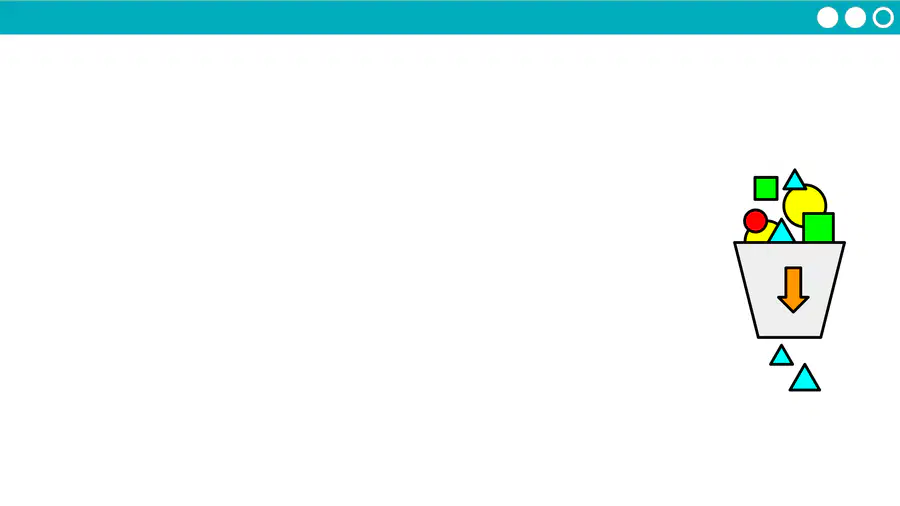
Filtering data allows the user to look at a subset of the
data.
In a future unit, we will learn how to filter data
programmatically to gain insight into knowledge from
data.
Software programs with built in tools (like the Data
Visualizer) can also be used to filter data.
15
Filtering Data
Open up Level 2.
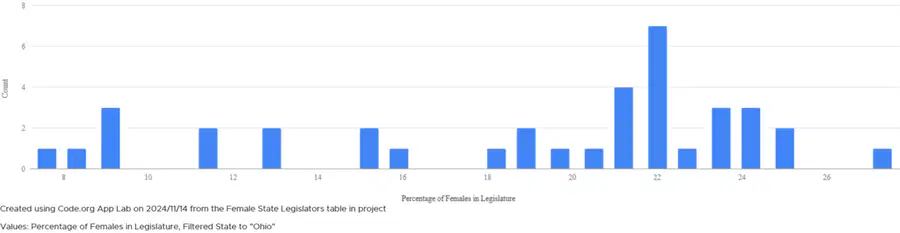
Find the peak level of female representation in Ohio's legislature.
What will you filter by?
Percentage of Females in Legislature or State?
Filter by state.
This means the data for female state legislators who are from Ohio are the only data that will be shown.
16
Filtering Data
Select Bar Chart and Percentage of Females in Legislators from the dropdowns
The bar farthest to the right represents the year(s) when female representation in the legislature was at its highest in Ohio's history.
17
Filtering Data
18
Filtering Data
When filtering, the most challenging part is deciding what value you will filter by
Think to yourself:
What's the limiting factor?
What do I want to make sure all these percentages have in common to be included in this subset?
19

Unit 5 Lesson 3 - Activity
Do This:
● Navigate to Level 2
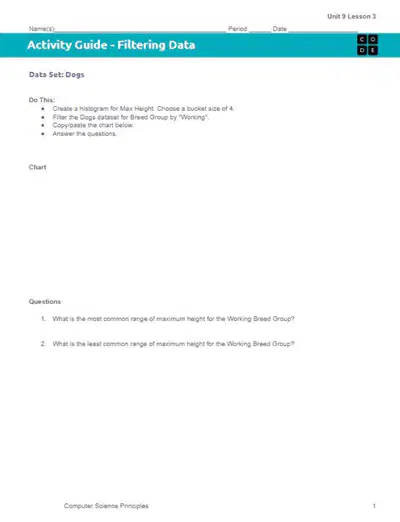
● Work through the
Activity Guide
● Copy/Paste the
charts you make into
the Activity Guide
20

21
Open Ended
Why is Clean and/or Filter an important part of the Data Analysis Process? What are situations when you would filter vs. clean your data?
22
Wrap Up
Messy data can lead to confusing charts that could be misinterpreted
Data should be filtered when you want to focus on a subset of the data
Filtering allows you to return to the full dataset if you have unanswered questions
23
Open Ended
What makes manually cleaning data challenging?
24
Wrap Up
Manually cleaning data can still result in errors
Accidentally cause a typo
Miss an entry
Smaller datasets are easier to manually clean than larger datasets
Unit 5 - Lesson 3
Filtering and Cleaning Data
Computer Science Principles
Show answer
Auto Play
Slide 1 / 24
SLIDE
Similar Resources on Wayground

21 questions
Caption
Presentation
•
12th Grade
19 questions
JUEGOS DIGITALES EN NIÑOS
Presentation
•
KG
21 questions
INput / OUTput Devices
Presentation
•
12th Grade
18 questions
projectile motion
Presentation
•
12th Grade
18 questions
Indirect questions
Presentation
•
12th Grade
20 questions
Literasi Digital (Konsep)
Presentation
•
12th Grade
20 questions
MIL lesson Types of Media Part2
Presentation
•
12th Grade
21 questions
KISI-KISI BAHASA JEPANG KLS XII (SMK)
Presentation
•
12th Grade
Popular Resources on Wayground
10 questions
HCS SCI 03 Summer School Review 4

Quiz
•
3rd Grade
11 questions
HSMS - Standard Response Protocol
Quiz
•
6th - 8th Grade
16 questions
1.1-1.2 Quiz Review
Quiz
•
9th - 12th Grade
12 questions
Exponent Expressions
Quiz
•
6th Grade
20 questions
Adding and Subtracting Integers
Quiz
•
6th - 7th Grade
11 questions
Northeast States
Quiz
•
3rd - 4th Grade
10 questions
Characterization
Quiz
•
3rd - 7th Grade
10 questions
Common Denominators
Quiz
•
5th Grade