Search Header Logo
Unit 3 Lesson 1

Unit 3 Lesson 1

Assessment

Presentation

•

Mathematics

•

9th - 12th Grade

•

Hard

Created by

James Gonzalez

FREE Resource

14 Slides • 22 Questions

1

Understand Linear and Nonlinear Functions

2

media

xy-plane

  • x-axis (horizontally left-to-right)

  • y-axis (vertically down-to-up)

  • positive values x-right / y-up

  • negative values x-left / y-down

3

Slope Intercept Form
  • Follows the format y=mx+b

  • Each letter tells us an important feature of the function.

  • m is the slope of the line

  • b is the y intercept (where the line crosses the y axis)

media

4

Multiple Choice

What is the slope of the line

y=−12x−4y=-\frac{1}{2}x-4  

1

−12-\frac{1}{2}  

2

-4

3

y

4

x

5

media

​slope

(m)

  • steepness of a line

  • ratio of the vertical change between two points, the rise, to the horizontal change between the same two points, the run.

6

Positive and Negative Slope
  • If a line has a positive slope, it points up to the right side of the graph

  • If a line has a negative slope, it points up to the left side of the graph

media

7

Multiple Choice

Question image

Does the following graph have a positive slope or a negative slope?

1

Positive

2

Negative

3

Neither

8

media

​

Find the slope of the line

​Two ways

1) difference of y's over differences of x's

2) COUNT!
-start at one point, count down/up and then over

9

media

​y-intercept

(b)

  • ​Where the line crosses the y-axis

  • At this point, x=0

  • To find the y-intercept (b), set x as zero in the equation.

  • (0, b)

10

Multiple Choice

What is the y intercept of this equation?

y=−3x−7y=-3x-7  

1

-3

2

-7

3

y

4

x

11

Multiple Choice

Question image

What is the y-intercept?

1

(0,15)

2

(3,0)

3

(15,0)

4

(0,3)

12

Multiple Choice

Question image

What is the y-intercept?

1

(2,0)

2

(0,2)

3

(0,-2)

4

(-2,0)

13

media

​Slope-Intercept Form

14

Multiple Choice

Write an equation in slope-intercept form:


Slope (m) = 10Slope\ \left(m\right)\ =\ 10  


y−intercept (b) = (0, 8)y-intercept\ \left(b\right)\ =\ \left(0,\ 8\right)  

1

y = 8x − 10y\ =\ 8x\ -\ 10  

2

y = 8x + 10y\ =\ 8x\ +\ 10  

3

y = 10x − 8y\ =\ 10x\ -\ 8  

4

y = 10x + 8y\ =\ 10x\ +\ 8  

15

Multiple Choice

Write an equation in slope-intercept form:


Slope (m)= 38Slope\ \left(m\right)=\ \frac{3}{8}  


y−intercept (b) = (0, −1)y-intercept\ \left(b\right)\ =\ \left(0,\ -1\right)  

1

y = 38x − 1y\ =\ \frac{3}{8}x\ -\ 1  

2

y = 38x + 1y\ =\ \frac{3}{8}x\ +\ 1  

3

y = 1x + 38y\ =\ 1x\ +\ \frac{3}{8}  

4

y = 1x − 38y\ =\ 1x\ -\ \frac{3}{8}  

16

From a Graph

Find the Slope


Find the y-intercept


Plug in the values to y = mx + b

media

17

Drag and Drop

Question image
Write the equation of the line.

y=​ ​
x​
​
Drag these tiles and drop them in the correct blank above
-5/4
-
1
+
5
4
5/4
4/5
-4/5
-1

18

Multiple Choice

Question image
Write the equation of the line.
1

y=35x+1y=\frac{3}{5}x+1

2

y=35x−1y=\frac{3}{5}x-1

3

y=53x+1y=\frac{5}{3}x+1

4

y=35x+1y=\frac{3}{5}x+1

19

media

Graphing Linear Functions

  • Only need two points

  • 1st point: start at the y-int (b)

  • 2nd point: use slope to find it!

20

Multiple Choice

 Select the graph for y=2x+3y=2x+3  

1
2
3

21

Multiple Choice

 Select the graph for y=−43x−1y=-\frac{4}{3}x-1  

1
2
3

22

​Graphing an Equation

​To graph an equation, it is easiest to make a function table first.


1) select values for x
2) plug them into the equation
3) solve for
y.
4) this gives us a coordinate pair
(x, y)
5) plot the points on a coordinate plane

​

​

​

media

23

Using Tables to Determine Linear and Nonlinear Relationships

to determine if a slope is constant, compare the slope between several ordered pairs

-
if the slope is constant, the function is linear

-
if the slope is not constant, the function is nonlinear

media

24

Multiple Choice

Question image

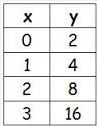
The table represents a function. Is it linear or non-linear?

1

Linear

2

Nonlinear

25

Multiple Choice

Question image

Is the table linear or nonlinear?

1

Linear

2

Nonlinear

26

Multiple Choice

Question image

Is this function linear or nonlinear?

1

Linear

2

Nonlinear

27

Multiple Choice

Question image

The slope of the line shown on the table is

1

−34-\frac{3}{4}  

2

34\frac{3}{4}  

3

−13-\frac{1}{3}  

4

310\frac{3}{10}  

28

Multiple Choice

Question image

The slope of the line shown on the table is

1

25\frac{2}{5}  

2

−25-\frac{2}{5}  

3

52\frac{5}{2}  

4

−52-\frac{5}{2}  

29

Multiple Choice

Question image

Is this function linear or non-Linear?

1

Linear

2

Non-Linear

30

Multiple Choice

Question image

Is this function linear or non-Linear?

1

Linear

2

Non-Linear

31

From a Graph
  • When graphed, a linear function forms a single straight line.

  • When graphed, a nonlinear function does not form a single straight line.

media

32

Multiple Choice

Question image

Is this function linear or nonlinear?

1

Linear

2

Nonlinear

33

Multiple Choice

Question image

Is the function Linear or Nonlinear?

1

Linear

2

Nonlinear

34

Multiple Choice

Question image

Determine if the graph is linear or nonlinear.

1

Linear

2

Nonlinear

35

Multiple Choice

Question image

Is the graph pictured a linear or nonlinear function?

1

Linear

2

Nonlinear

36

www.joinmyquiz.com
media

​78208707

pattern-tertiary
Understand Linear and Nonlinear Functions

Show answer

Auto Play

Slide 1 / 36

SLIDE