Search Header Logo
Scatterplots and Matrices

Scatterplots and Matrices

Assessment

Presentation

Mathematics

8th Grade

Easy

CCSS
HSS.ID.B.6, HSA.CED.A.2, HSN.VM.C.8

+11

Standards-aligned

Created by

Megan Sanders

Used 3+ times

FREE Resource

6 Slides • 20 Questions

1

Scatterplots and Matrices

By Megan Sanders

2

media

3

media

4

media

5

Multiple Choice

What is a scatter plot?
1
A graph that shows the relationship of two data sets.
2
A graph drawn using rectangular bars to show how large each value is.
3
A graph that shows information that is connected in some way.
4
A graph that shows data changing over time.

6

Multiple Choice

Question image
What type of association (correlation) does this graph have?
1
positive 
2
negative
3
none
4
all of the above

7

Multiple Choice

Question image
Which best describes the form of this scatterplot?
1
linear
2
nonlinear
3
scattered

8

Multiple Choice

Question image
Which sentence describes the relationship shown on this scatterplot?
1
As the temperature decreases, the visitors increase. 
2
As the temperature increases, the number of visitors increases. 
3
As the visitors increase, the temperature decreases. 
4
No correlation

9

Multiple Choice

Question image
The scatter plot shows the relationship between the number of chapters and the total number of pages for several books.  Use the trend line to predict how many chapters would be in a book with 180 pages. 
1
12 chapters
2
15 chapters
3
18 chapters
4
21 chapters

10

Multiple Choice

Question image
Based on the graph, if Joe earned $400, how many hours did he work?
1
25 hours
2
35 hours
3
45 hours
4
15 hours

11

Multiple Choice

Question image
Which scatter plot shows a linear relationship between x and y?
1
Graph A
2
Graph B
3
Graph C
4
Graph D

12

Multiple Choice

Question image
Mrs. Collins made a scatterplot to show the relationship between the number of absences and a student’s final exam score. Based on this scatterplot, a student with 6 absences should get approximately what score on the final exam? 
Hint: create the trend line first
1
65
2
92
3
70
4
76

13

Multiple Choice

Question image

The scatter plot shows the relationship between the number of chapters and the total number of pages for several books.  Use the trend line to predict how many pages would be in a book with 6 chapters. 

1

60 pages

2

40 pages

3

18 pages

4

10 pages

14

Multiple Choice

Question image
Which graph shows a line of best fit for the scatter plot?
1
Graph A
2
Graph B
3
Graph C
4
Graph D

15

Multiple Choice

Which graph shows the best trendline to represent the data?

1
2
3
4

16

media
media

​The size of a matrix are called its "dimensions"

17

Multiple Choice

Question image
Name the dimensions:
1
6x2
2
2x6
3
12
4
36

18

Multiple Choice

Question image
Name the dimensions
1
3x1
2
1x3
3
3
4
1

19

Multiple Choice

Question image
What are the dimensions of this matrix?
1
2 x 3
2
3 x 2
3
6 x 1
4
1 x 6

20

media

​How to add matrices:

media

​How to multiply by a factor out front:

21

Multiple Choice

Question image
Add
1
11    8
-4     2
2
3     2
-6    -6
3
-3    2
-4    -6
4
10    8
-6    2

22

Multiple Choice

Question image
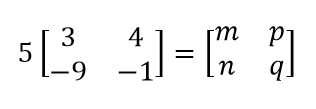
What do m, n, p and q equal in this scalar matrix multiplication?
1
m=8, n=9, p=-4, q=4 
2
m=15, n = -45, p=20, q=-5
3
m=20, n=-5, p=15, q=-45
4
m=-5, n=20, p=-45, q=15

23

Multiple Choice

Question image
Add.
1
-2   4   -9
-1   -6   -17
2
-8   12   -9
1   6   17
3
-8   4   -9
15   6   7
4
-2   -4   -9
15   6    7

24

Multiple Choice

Question image
Subtract
1
3    -8
0   -1
2
3   -4
8  -13
3
-3   8
0    1
4
3   -8
-8    1

25

Multiple Choice

Question image
Multiply
1
25
25
5
2
-25
25
-5
3
-10
-10
-6
4
10
10
6

26

Multiple Choice

Question image

Find A-B
(SUBTRACT them)

1
-3     1
7     -1
2
1     0
1     -4
3
-4       0
6     -1
4
not possible because rows do not match columns

Scatterplots and Matrices

By Megan Sanders

Show answer

Auto Play

Slide 1 / 26

SLIDE