
Linear Regressions and Scatterplots
Presentation
•
Mathematics
•
9th Grade
•
Hard

Joseph Anderson
FREE Resource
17 Slides • 20 Questions
1

2

3
4

5

6
Open Ended

Give an example of when scatterplots would be useful outside of the classroom.
7
8
Multiple Choice
9
Multiple Choice
10
Multiple Choice
11

12

13

14
Multiple Choice
15
Multiple Choice

16
Poll

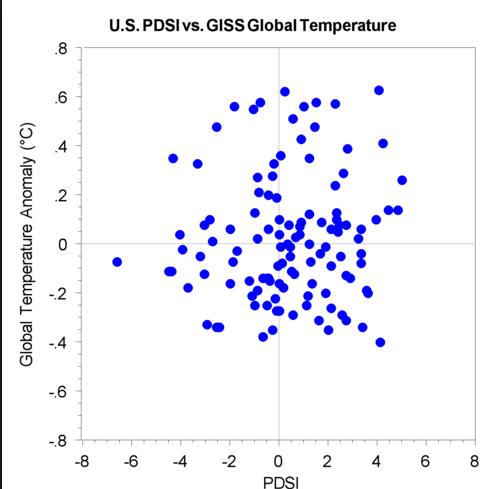
Does this scatterplot have a positive or negative correlation?
17
Multiple Choice
18

19
20
Multiple Choice
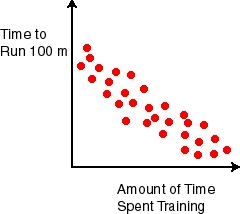
Estimate the correlation coefficient
21
Multiple Choice

Estimate the correlation coefficient.
22

23
Multiple Choice
Estimate the correlation coefficient.
24

25
26

27

28
Multiple Choice

29
Multiple Choice

Write the equation for the linear regression shown.
30
Multiple Choice
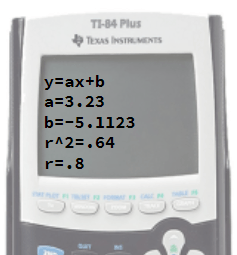
Write the equation for the linear regression shown.
31
Multiple Choice

What is the line of best fit?
32
Multiple Choice
33
Multiple Choice

34
Multiple Choice

35
Multiple Select
36
Multiple Choice
37
Show answer
Auto Play
Slide 1 / 37
SLIDE
