
Basic Statistics Review
Presentation
•
Mathematics
•
6th - 8th Grade
•
Hard
Joseph Anderson
FREE Resource
33 Slides • 79 Questions
1
2
3
A statistical question....
Requires you to gather data
Is not a yes or no question
One that can be answered by collecting multiple data and where there will be opportunity for variability in that data.
4
Statistics is the process of collecting, organizing, and interpreting pieces of information, or data.
Statistical Questions: are questions that anticipate and accounts for a VARIETY of answers.
5
Multiple Choice
How long did it take for each person to get to to school?
Statistical
Non-statistical
6
Multiple Choice
How many siblings do you have?
Statistical
Non-statistical
7
Multiple Choice
What is your favorite color?
Statistical
Non-statistical
8
Multiple Choice
How many books do each student in your class have?
Statistical
Non-statistical
9
Multiple Choice
What is the average or typical number of Chromebooks each student was given by the school?
Statistical
Non-statistical
10
Multiple Choice
What is the average or typical number dogs in each Kennedy family?
Statistical
Non-statistical
11
Dot Plots
Each dot represents one answer. In the sheet to the right, 3 students answered that they had 0 cookies at lunch. 5 said they had 2 cookies.
12
Multiple Choice
This is a
dot plot
frequency table
relative frequency table
histogram
13
Outlier
If there is a number far from the normal set, we call that the outlier.
1,10,12,15,16
The outlier is 1.
14
Multiple Choice
What is the outlier for this data?
90
96
102
108
15
Multiple Choice
How many students took the quiz? (count the dots)
15
20
12
17
16
Shape of a dot plot graph
Normal is like a symmetrical hill or an upside-down U.
17
Skewed Right
Think of it like a tail. If the numbers decrease on the right side of a graph, the tail goes to the right, and the graph is skewed right.
18
Skewed Left
Our tail is on the left side. We say that these graphs are skewed left.
19
Multiple Choice
20
Multiple Choice
SUVs: Symmetrical
Cars: Skewed left
Both are skewed left.
Both are symmetrical.
SUVs: Skewed right
Cars: Skewed left
21
Multiple Choice
22
Multiple Choice
23
Multiple Choice
What is the outlier for this data?
90
96
102
108
24
We can use the dot plot to find Mean, Median, and Mode
Remember, write out all your numbers in numerical order then solve the problem.
25
Multiple Choice
What is the median of the data?
2
1
3
12
26
Multiple Choice
27
Multiple Choice
28
Multiple Choice
29
Multiple Choice
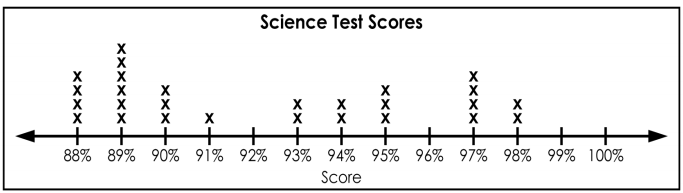
What is the highest score anyone in the class received on the test?
89%
100%
95%
98%
30
Multiple Choice
What was the most common score the students got on the test (the mode)?
88%
100%
89%
98%
31
32
Skewed Left or Right
When a distribution is skewed left, the mean is less than the median.
When a distribution is skewed right, the mean will be more than the median.
33
Bell or Symmetrical Distributions
Symmetrical distributions of data can also be called normal or bell-shaped.
Since their distribution is fairly normal, the mean and the median will be close to the same.
34
Multiple Choice
Describe the shape of the distribution.
symmetric
skewed left
skewed right
35
Multiple Choice
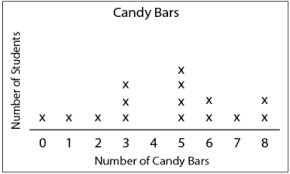
How many students had more than 6 candy bars?
5
2
3
1
36
Multiple Choice
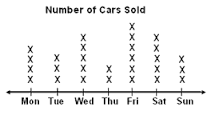
How many cars were sold on Saturday and Sunday?
5
3
8
10
37
Multiple Choice
38
Multiple Choice
How many students have 0 Brothers and Sisters?
6 students
0 students
12 students
10 students
39
Box Plot Diagram
40
41
Multiple Choice
What amount of cupcakes makes up the middle 50% of the data?
16-22 cupcakes
12-32 cupcakes
22-28 cupcakes
16-28 cupcakes
42
Multiple Choice
What amount of cupcakes makes up the lower 25% of the data?
16-22 cupcakes
12-16 cupcakes
22-28 cupcakes
28-32 cupcakes
43
44
45
Fill in the Blank
Type answer...
46
Fill in the Blank
Type answer...
47
Fill in the Blank
Type answer...
48
5 Number Summary
We use the five number summary to create and help interpret data from a box plot. The 5 number summary includes: Minimum, Maximum, (Q1) Quartile 1 or Lower Quartile, (Q2) Median, and (Q3) Quartile or Upper Quartile.
49
Parts of a Box Plot
Min – Minimum: Smallest number of the Data Set
Q1 – Lower Quartile: The median of the lower half of the data
Q2 – Median: Middle number of the set of data
Q3 – Upper Quartile: The median of the upper half of the data
Max – Maximum: Largest number in the data set
Interquartile Range (IQR): Q3 – Q1
50
Multiple Choice
What does a box plot NOT allow you to find?
Median
Mean
Range
Interquartile Range (IQR)
Q1 and Q2
51
Quartiles
Quartiles divide the data set into four equal parts.
25% each
52
Median
Divides the data set into two halves
50% of the data numbers are below this number
50% of the data numbers are above this number
53
Multiple Choice
Which teaching method had the most variability of scores (most stretched out)?
Method 1
Method 2
Method 3
Method 4
54
Multiple Choice
Which 5 number summary matches the box plot?
55
Fill in the Blank
Type answer...
56
Multiple Choice
The box plot shows the distribution of scores on a math test. Which score was greater than or equal to 75% of all scores?
100
90
65
70
57
Multiple Choice
The box plot shows finishing times for a local 5K race. Between what times did 50% of the runners finish?
14 to 26 minutes
14 to 21 minutes
12 to 26 minutes
21 to 26 minutes
Not enough information
58
Multiple Choice
The box plot shows finishing times for a local 5K race. Between what times do 75% of the runners finish?
14 to 26 minutes
14 to 21 minutes
12 to 26 minutes
21 to 26 minutes
59
60
61
Multiple Choice
What number represents the lower extreme or minimum? / ¿Qué número representa el extremo inferior o el mínimo?
13
16
23
25
62
Fill in the Blank
Type answer...
63
Multiple Choice
What is the median shown on this graph? / ¿Cuál es la mediana que se muestra en este gráfico?
200
250
500
720
64
Multiple Choice
What is the upper quartile? / ¿Qué es el cuartil superior?
20
30
70
95
65
Fill in the Blank
Type answer...
66
Multiple Choice
What is the upper quartile shown in this graph? / ¿Cuál es el cuartil superior que se muestra en este gráfico?
18
21
21.5
23
67
Multiple Choice
What percentage of the data is between 30 and 70?
25%
50%
75%
100%
68
Multiple Choice
What percentage of the data is between 20 and 80?
25%
50%
75%
100%
69
The Box and Whisker plot is divided in to 4 parts.
Each Part is 25% of the data set or ¼.
Analyzing the Data Set
70
Multiple Choice
What percentage of the data is Below 30?
25%
50%
75%
100%
71
Multiple Choice
What percentage of the data is greater than 30?
25%
50%
75%
100%
72
Multiple Choice
73
Box Plot
The five-number summary:
Min: Minimum or lowest number in the data set
Max: Maximum or highest number in the data set
Median: The value in the middle of the data set when the numbers are in order from least to greatest
Lower Quartile: The median of the lower half of the data when the numbers are in order
Upper Quartile: The median of the upper half of the data when the numbers are in order
74
Multiple Choice
I can use data from a random sample to draw inferences about a population with an unknown characteristic of interest.
What is the most common amount of siblings to have shown in the histogram?
0
1
4
5
75
76
Multiple Choice
77
Fill in the Blank
Type answer...
78
Multiple Choice
between what ages were the least amount of people at the bowling alley?
6-15
16-25
26-35
36-45
79
Fill in the Blank
Type answer...
80
Fill in the Blank
Type answer...
81
Multiple Choice
How many times did she practice for less than 30 minutes?
13
9
12
17
82
Multiple Choice
83
Multiple Choice
In which interval is the peak of the data?
0 to 4
5 to 9
10 to 14
15 to 19
20 to 24
84
Multiple Choice
Which interval has exactly 400 employees?
33-43
0-10
77-87
66-76
85
You can use histograms to determine how your data is distributed and/or skewed. You consider the MEAN and the MODE of the data set.
Definition
86
Left-Tailed Skewed
The bulk of the observations are at or above the median but there are a few observations that are much smaller than the rest.
Right-Tailed Skewed
The bulk of the observations are at or below the median but there are a few observations that are much larger than the rest.
87
Multiple Choice
2, 57, 38, 42, 6
88
Multiple Choice
What is their average height?
89
Multiple Choice
Find the mean giraffe heights.
15
15.5
15.7
28.2
90
Multiple Choice
91
Multiple Choice
The temperature in Michigan City on this date in the last ten years were: 68, 68, 69, 70, 72, 70, 68, 75, 55, 67. What is the mean temperature on this date over the last ten years? (Round to nearest whole number.)
60
61
68
69
92
Multiple Choice
5,11,2,12,4,2
93
Multiple Choice
28, 18, 19, 18, 17
94
Multiple Choice
Calculate the mean.
10, 4, 5, 9
7
5
8
4
95
Multiple Choice
96
Multiple Choice
What is the MODE for this data?
85
97
Multiple Choice
98
Multiple Choice
What is the MODE of this data?
60
99
Multiple Choice
To get the ______, add up all the numbers in a data set and divide by the amount of numbers in the data set.
Median
Mean
Mode
Range
100
Multiple Choice
To get the ________, subtract the smallest number in the data set from the biggest number in the data set.
Mean
Median
Mode
Range
101
Multiple Choice
To get the _______, order the numbers in the data set from smallest to biggest and find the middle number in the data set.
Mean
Median
Mode
Range
102
Multiple Choice
To get the ________, select the number that occurs the most in a data set aka the most popular number.
Mean
Median
Mode
Range
103
104
Multiple Choice
Find the Mean of the Data Set:
7, 8, 3, 4, 8
7
6
5
4
105
MEDIAN
Order the numbers from least to greatest, then select the number in the middle.
106
Multiple Choice
Find the Median in the Data Set:
7, 8, 3, 4, 8
7
8
4
3
107
Fill in the Blank
Type answer...
108
MODE
a.k.a. The Most Popular Number
109
Fill in the Blank
Type answer...
110
RANGE
Subtract the lowest number from the highest number.
111
Fill in the Blank
Type answer...
112
Show answer
Auto Play
Slide 1 / 112
SLIDE
Similar Resources on Wayground
99 questions
F3 Family Ties L6
Presentation
•
7th - 8th Grade
106 questions
Introduction to Ecology Ecological Organization
Presentation
•
6th - 8th Grade
106 questions
Ecological Species
Presentation
•
6th - 8th Grade
104 questions
Rational Numbers Study Guide
Presentation
•
7th Grade
108 questions
Study Sheet Election 2020
Presentation
•
7th - 8th Grade
107 questions
Distributive Property Lesson
Presentation
•
6th Grade
115 questions
Evaluating Expressions Using Order of Operations
Presentation
•
6th - 8th Grade
111 questions
One-Step Equation
Presentation
•
6th - 8th Grade
Popular Resources on Wayground
20 questions
STAAR Review Quiz #3
Quiz
•
8th Grade
20 questions
Equivalent Fractions
Quiz
•
3rd Grade
6 questions
Marshmallow Farm Quiz
Quiz
•
2nd - 5th Grade
20 questions
Main Idea and Details
Quiz
•
5th Grade
20 questions
Context Clues
Quiz
•
6th Grade
20 questions
Inferences
Quiz
•
4th Grade
19 questions
Classifying Quadrilaterals
Quiz
•
3rd Grade
12 questions
What makes Nebraska's government unique?
Quiz
•
4th - 5th Grade
Discover more resources for Mathematics
10 questions
Box Plots
Quiz
•
6th - 7th Grade
14 questions
Volume of rectangular prisms
Quiz
•
7th Grade
25 questions
GM Review
Quiz
•
6th Grade
15 questions
Pythagorean Theorem Word Problems Quizizz
Quiz
•
8th Grade
22 questions
Dot Plots and Histograms
Quiz
•
6th Grade
22 questions
Simple Probability
Quiz
•
7th Grade
20 questions
Graphing Inequalities on a Number Line
Quiz
•
6th - 9th Grade
20 questions
Ratios/Rates and Unit Rates
Quiz
•
6th Grade