
Economics Graphs
Presentation
•
Social Studies
•
12th Grade
•
Hard

Joseph Anderson
FREE Resource
13 Slides • 9 Questions
1
ECONOMICS TOPIC 1 LESSON 3
PRODUCTION POSSIBILITIES
2
ESSENTIAL QUESTION
How does scarcity affect everyone? What is opportunity cost?

3
4
OBJECTIVES
Interpret a production possibilities curve.
Explain how production possibilities curves show efficiency, growth, and opportunity cost.
Explain why a country’s production possibilities depend on its resources and technology.

5
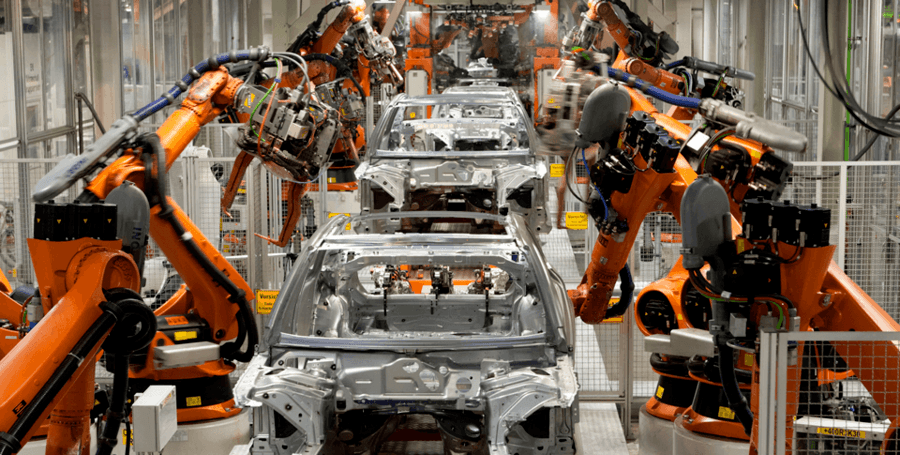
Production Possibilities
To decide what and how much to produce, economists use a tool known as a production possibilities curve.
6
Production Possibilities
Economists often use graphs to analyze the choices and trade-offs that people make. Why? Because graphs help us see how one value relates to another value. A production possibilities curve is a graph that shows alternative ways to use an economy’s productive resources.
7
Fill in the Blanks

Type answer...
8
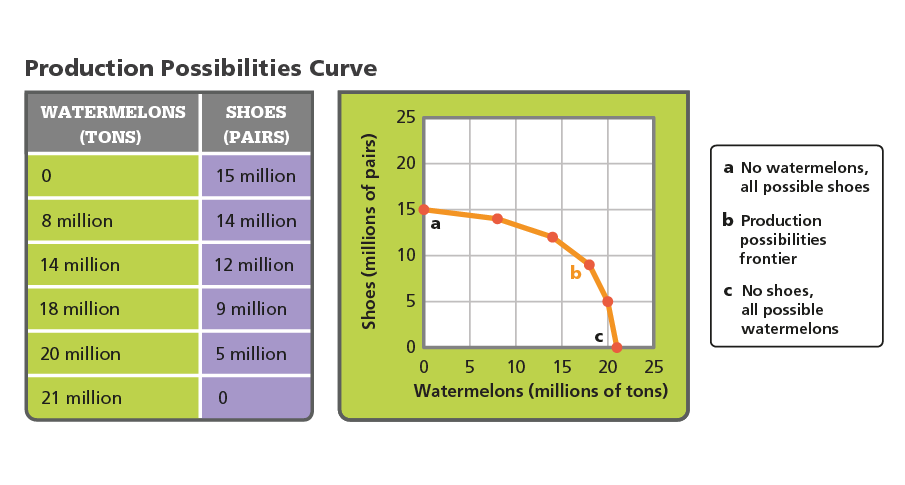
Drawing a Production Possibilities Curve
To draw a production possibilities curve, an economist begins by deciding which goods or services to examine.
9
Open Ended

Analyze Graphs Is it more efficient to produce 8 million tons of watermelons and 14 million pairs of shoes or 21 million tons of watermelons and no shoes? Explain your answer.
10
Drawing a Production Possibilities Curve
The production possibilities frontier, shows combinations of production . Any spot on that line represents a point at which all of its resources are being used to the maximum combination of two products.
11
Multiple Choice
12
Changing Production Possibilities
Production possibilities curves give useful information. They can show how efficient an economy is, whether an economy is growing, and the opportunity cost of producing more of one good or service.

13
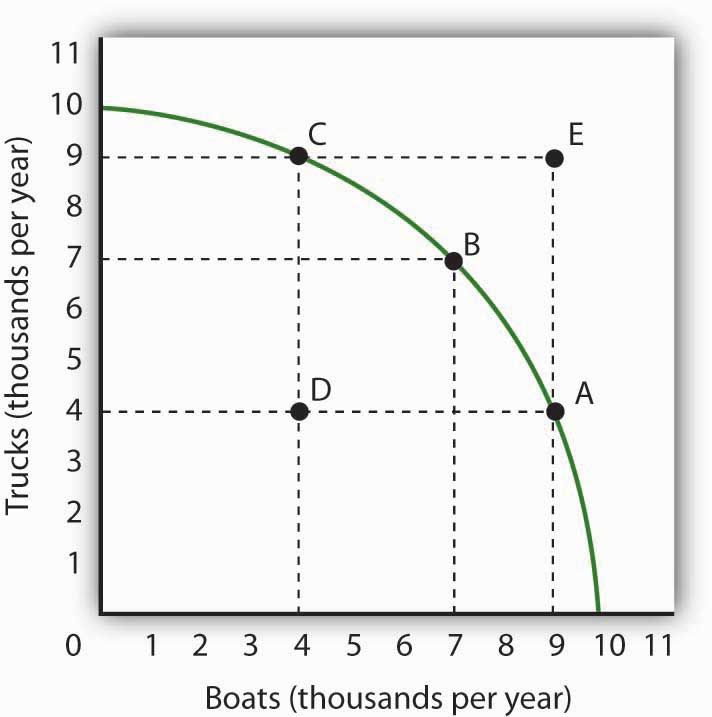
Efficiency
A production possibilities frontier represents an economy working at its most efficient level. Efficiency is the use of resources in such a way as to maximize the output of goods and services.

14
underutilization
Any point inside the production possibilities frontier indicates underutilization, or the use of fewer resources than the economy is capable of using. At point b Capeland is growing 5 million tons of watermelons and making 8 million pairs of shoes. This is inefficient because it is less than the maximum possible production.
15
Growth
A production possibilities curve is a snapshot. It reflects current production possibilities as if a country’s resources were frozen in time. In the real world, however, available resources are constantly changing. If the quantity or quality of land, labor, or capital changes, then the curve will move.
16
Technology and Training
When economists collect data to create production possibilities curves, they must first determine which goods and services a country can produce with its current resources. A country’s resources include its land and natural resources, its workforce, and its physical and human capital.
17
Multiple Choice
18
Multiple Choice

19
Multiple Choice

20
Multiple Choice
21
Multiple Choice
22
Multiple Choice

The table shows the production possibilities for a country. Based on the table, which of the following production combinations is a possibility?
ECONOMICS TOPIC 1 LESSON 3
PRODUCTION POSSIBILITIES
Show answer
Auto Play
Slide 1 / 22
SLIDE
