
6.SP.1-5 Practice
Presentation
•
Mathematics
•
6th - 8th Grade
•
Hard
+1
Standards-aligned

Kara Robinson
Used 4+ times
FREE Resource
24 Slides • 51 Questions
1

2

3

4

5

6

7

8

9

10

11

12

13

14

15

16

17

18

19

20

21

22

23

24

25
Multiple Choice
26
Multiple Choice
27
Multiple Choice
28
Multiple Choice

29
Multiple Choice
30
Multiple Choice
31
Multiple Choice
32
Multiple Choice
33
Multiple Choice

At Donald's Donuts the number of donut holes in a bag can vary. Help Donald find the MODE.
12,10,10,10,13,12,11,13,10
34
Multiple Choice
35
Multiple Choice
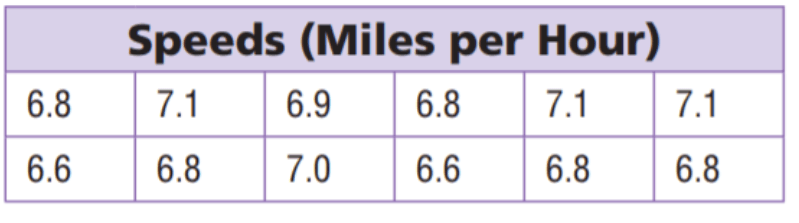
What is the range of speeds tested?
36
Multiple Choice
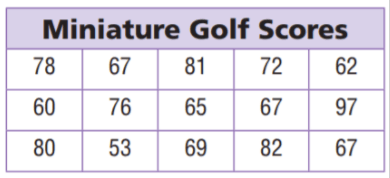
What is the range of miniature golf scores?
37
Multiple Choice
38
Multiple Choice
39
Multiple Choice
40
Multiple Choice
41
Multiple Choice
42
Multiple Choice
43
Multiple Choice
44
Multiple Choice
45
Multiple Choice
46
Multiple Choice
47
Multiple Choice
48
Multiple Choice

Identify the outlier for the given data?
23, 34, 27, 7, 30, 26, 28, 31, 34
49
Multiple Choice

Your math grades are 90, 85, 0, 90, 80, 100, and 90. Which grade is the outlier?
50
Multiple Choice

51
Multiple Choice
52
Multiple Choice

53
Multiple Choice
54
Multiple Choice
55
Multiple Choice

56
Multiple Choice

57
Multiple Choice

58
Multiple Choice

59
Multiple Choice
60
Multiple Choice

What is the interquartile range of these scores?
61
Multiple Choice

62
Multiple Choice

What amount of cupcakes makes up the middle 50% of the data?
63
Multiple Choice
What amount of cupcakes makes up the lower 25% of the data?
64
Multiple Choice
65
Multiple Choice

66
Multiple Choice

67
Multiple Choice
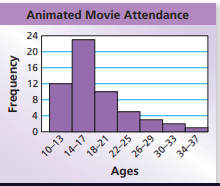
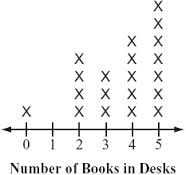
What is the shape of the data?
68
Multiple Choice
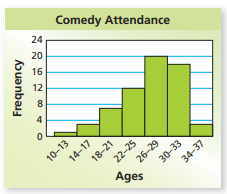
What is the shape of the data?
69
Multiple Choice
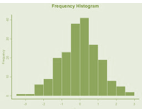
Describe the shape of the graph.
70
Multiple Choice
71
Multiple Choice
72
Multiple Choice

73
Multiple Choice
74
Multiple Choice

Choose the best description of the overall shape of the dot plot.
75
Multiple Choice

True or false, the data is skewed.
Show answer
Auto Play
Slide 1 / 75
SLIDE
