

Part 3: Quantitative Data

Presentation
•
Mathematics
•
11th Grade
•
Practice Problem
•
Hard

Samantha Jacobson
FREE Resource
71 Slides • 24 Questions
1

2

3
Open Ended
Just a review... what kind of data is used for bar charts and pie charts?
4
Multiple Choice
Why is it important to summarize quantitative data when dealing with large datasets?
It helps us understand the data more easily.
It makes the data look more attractive.
It reduces the amount of data we have to store.
It allows us to use bar and pie charts.
5

6
Multiple Choice
What is the purpose of dividing the span of values into bins when creating a histogram?
To make the data easier to analyze by grouping values
To increase the number of data points
To reduce the range of the data
To eliminate outliers
7

8
Open Ended
How does a histogram display the distribution of earthquake magnitudes, and what information can be quickly observed from it?
9

10
Multiple Select
Which of the following statements about relative frequency histograms is/are correct?
They display the percentage of cases in each bin.
They use counts instead of percentages.
They are faithful to the principle of displaying distributions.
They do not show the distribution at a glance.
11

12
Fill in the Blanks
The age group with the highest frequency in the histogram example is
Type answer...
13

14
Multiple Choice
Given the touchdown passes for Brett Favre, what would be the first step in creating a histogram for this data?
Divide the data into bins of equal width
Calculate the mean of the data
Draw a bar chart
Sort the data in ascending order
15

16
Open Ended
In what way do stem-and-leaf displays differ from histograms, and what advantage do they offer?
17

18
Open Ended
Compare the histogram and stem-and-leaf display for the points scored in a basketball game. Which graphical display do you prefer?
19

20
Multiple Choice
What is the purpose of including a key in a stem-and-leaf display?
To show the frequency of each value
To explain what the stems and leaves represent
To label the bins
To round the data values
21
Multiple Choice
Which of the following is NOT a step in constructing a stem-and-leaf display?
Use the stems to label the bins.
Use only one digit for each leaf.
Forget to include a key.
Cut each data value into leading and trailing digits.
22

23
Fill in the Blanks
Based on the pepper pungency data, what is the range of values (in thousands of Scoville units) for the 24 tabasco peppers?
Type answer...
24
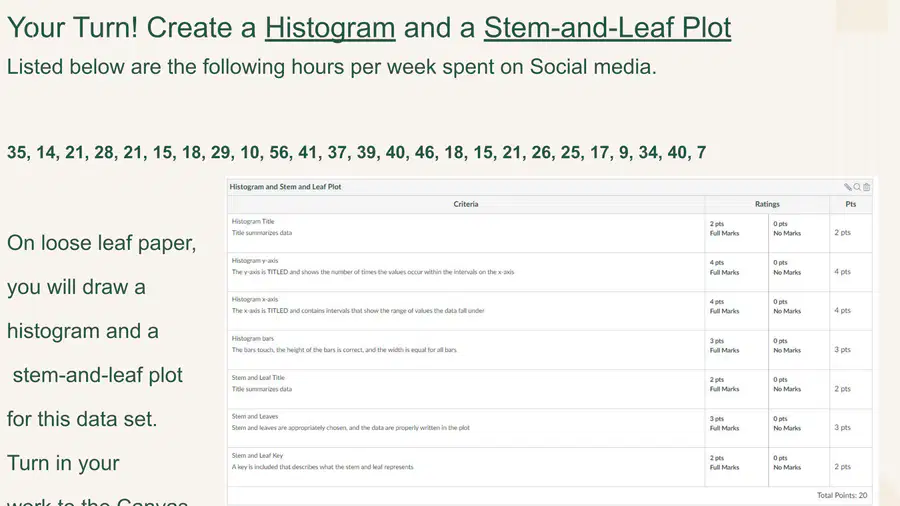
25

26

27

28
Open Ended
What's wrong with the dotplot shown in the image?
29

30
Multiple Choice
What is the purpose of creating a dotplot as described in the instructions?
To compare two different classes
To find out how many words you can type in one minute
To practice drawing graphs
To learn about different types of charts
31

32

33
Open Ended
Explain why it is important to think carefully about which type of data display to use when presenting quantitative data.
34
Multiple Choice
Before making a dotplot, what important condition should you check according to the Quantitative Data Condition?
The data are values of a categorical variable
The data are values of a quantitative variable whose units are known
The data are values of a qualitative variable
The data are values of a binary variable
35

36
Fill in the Blanks
When describing a distribution, what three aspects should you always mention?
Type answer...
37

38
Multiple Select
Which of the following questions help you determine the shape of a distribution?
Does the histogram have a single, central hump or several separated humps?
Is the histogram symmetric or skewed?
Do any unusual features stick out?
What is the mean of the data?
39

40
Multiple Choice
What is the term for humps in a histogram, and how are histograms classified based on the number of peaks?
Modes; unimodal, bimodal, multimodal
Tails; left-tailed, right-tailed, symmetric
Centers; central, off-center, distributed
Bins; single-bin, double-bin, multi-bin
41

42
Multiple Choice
Based on the histogram shown, how would you describe a distribution with two apparent peaks?
Bimodal
Unimodal
Uniform
Skewed
43
44
Fill in the Blanks
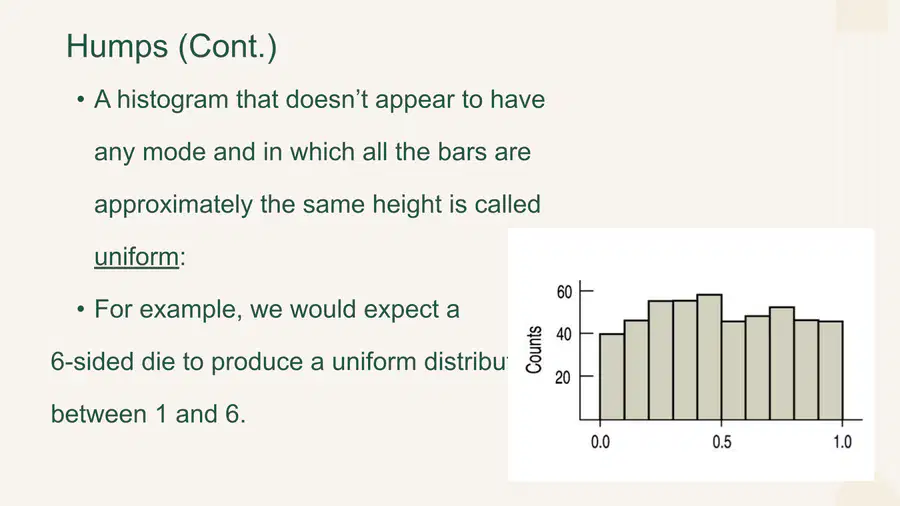
Fill in the blank: A histogram in which all the bars are approximately the same height and does not appear to have any mode is called
Type answer...
45

46

47
Multiple Choice
Which of the following statements about the tails of a distribution is correct?
The thinner ends are called tails, and if one tail is longer, the histogram is skewed to that side.
The thicker ends are called tails, and if one tail is longer, the histogram is symmetric.
The thinner ends are called peaks, and if both are equal, the histogram is bimodal.
The thicker ends are called peaks, and if both are equal, the histogram is uniform.
48

49
50

51

52

53

54

55

56

57

58

59

60

61

62

63
64
65

66

67

68

69

70

71

72

73

74
75

76

77

78

79

80
81

82

83

84

85

86
87
88

89

90

91
92

93
94
Open Ended
What is one thing you learned today about dealing with quantitative data that you found most useful or interesting?
95
Multiple Choice
Why is it important to summarize quantitative data when dealing with large sets of numbers?
It helps us understand the data more easily.
It makes the data more complicated.
It hides important information.
It is required for all types of data.
Show answer
Auto Play
Slide 1 / 95
SLIDE
Similar Resources on Wayground

90 questions
PowerPoint - Introduction to Professional Communication
Presentation
•
10th Grade
85 questions
Chapter 26 Lesson 3
Presentation
•
10th Grade
87 questions
Transformers
Presentation
•
12th Grade
94 questions
JUPAS TALK
Presentation
•
10th Grade
86 questions
ELL Animals
Presentation
•
12th Grade
90 questions
Math 10 - Semester 2 - Final Review
Presentation
•
10th Grade
94 questions
Sendri_LKPD_Interaktif_Fix
Presentation
•
11th Grade
91 questions
Present Simple and Present Continuous
Presentation
•
10th - 12th Grade
Popular Resources on Wayground
10 questions
Safety Day 2026 – Student Review

Quiz
•
9th Grade
21 questions
Continents and Oceans
Quiz
•
6th Grade
20 questions
Parts of Speech
Quiz
•
5th Grade
16 questions
Subject & Predicate
Quiz
•
5th Grade
25 questions
Multiplication Facts
Quiz
•
5th Grade
12 questions
Map Skills
Quiz
•
3rd Grade
22 questions
Continents and Oceans
Quiz
•
5th Grade
15 questions
Rounding Decimals
Quiz
•
5th Grade
Discover more resources for Mathematics
12 questions
Identify Rigid Transformations
Quiz
•
8th - 12th Grade
10 questions
Complementary, Supplementary, Vertical, and Linear Pairs
Quiz
•
9th - 12th Grade
22 questions
Identify Vertical and Horizontal Translations
Quiz
•
9th - 12th Grade
10 questions
Graphing Inequalities on a Number Line
Quiz
•
9th - 12th Grade
17 questions
Identifying Parallel And Perpendicular Lines
Quiz
•
9th - 12th Grade
18 questions
Integer Operations
Quiz
•
5th - 12th Grade
18 questions
Parallel lines cut by a transversal
Quiz
•
9th - 11th Grade
14 questions
Evaluate Linear Functions and Their Applications
Quiz
•
9th - 12th Grade