Search Header Logo
IELTS WRITING TASK 1 - LINE GRAPH - ELDERLY PEOPLE - FREE TIME

IELTS WRITING TASK 1 - LINE GRAPH - ELDERLY PEOPLE - FREE TIME

Assessment

Presentation

English

6th - 8th Grade

Practice Problem

Hard

Created by

Ánh Ngọc

FREE Resource

2 Slides • 14 Questions

1

IELTS WRITING TASK 1 - LINE GRAPH
Elderly people spending free time

By Ánh Ngọc

2

Open Ended

Question image

Guess the activity from the equipment shown in the picture.

3

Draw

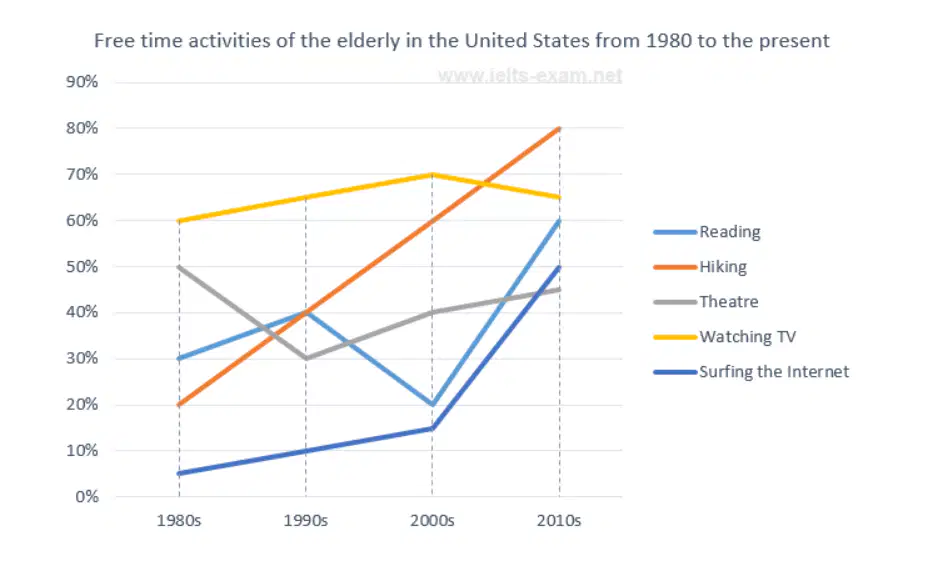
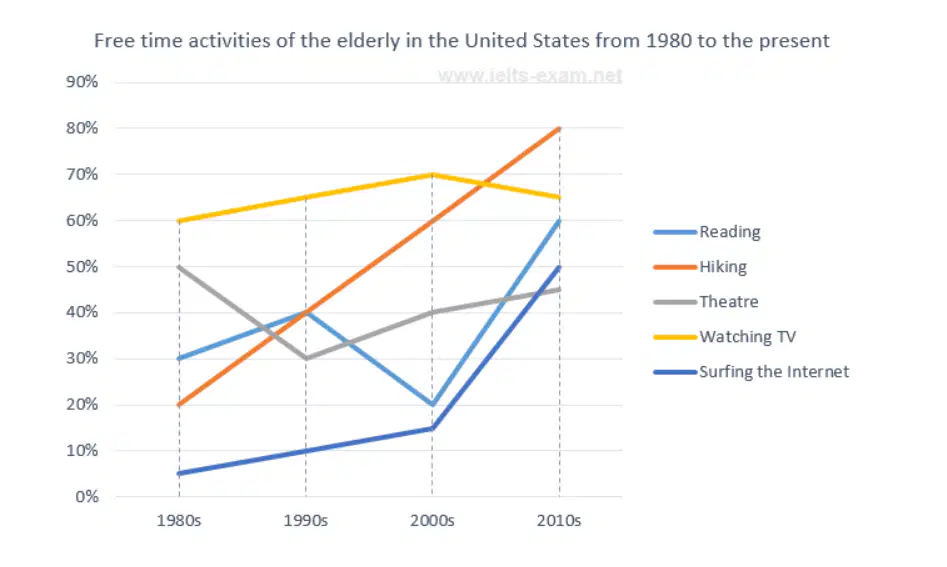
The line graph illustrates the proportion of elderly people in the United States engaging in five different leisure activities from 1980 to the present.

Overall, watching TV consistently remained the most popular pastime among the elderly, while hiking experienced a dramatic increase to become the leading activity in recent years. In contrast, theatre attendance fluctuated, and internet usage, though starting from a negligible base, rose sharply.

In 1980, around 60% of older Americans watched TV in their free time, followed by 50% attending theatre. Hiking and reading were considerably less popular, with only 20% and 30% participation respectively, while internet use was minimal at 5%. Over the next three decades, watching TV grew steadily to peak at 70% in the 2000s before slightly declining.

Hiking, however, underwent the most remarkable change, climbing from just 20% in 1980 to 80% in the 2010s, surpassing all other activities. Reading showed fluctuations, dipping in the 2000s but recovering strongly to 60% by the 2010s. Similarly, internet usage surged to 50% in the final decade, whereas theatre attendance dropped initially before stabilising at around 45%.

4

media

1. Which activity increased the most overall from 1980 to the 2010s, and how does it compare with the others?

2. Which activity remained the most popular throughout the period, and did any activity overtake it?

3. Which activity showed the most fluctuation, and how is this different from the steady trends of other activities?

4. How did new activities (like internet surfing) compare with traditional ones (e.g., reading, theatre) by the 2010s?

5. Looking at the 2010s, which activities had similar participation rates, and what does this reveal about changing preferences among the elderly?

5

Open Ended

Question image

Overall, watching TV consistently remained ............. among the elderly, while hiking .................... to become the leading activity in recent years.

6

Open Ended

Question image

In 1980, around 60% of older Americans watched TV in their free time, followed by ..............................

7

Open Ended

Question image

Over the next three decades, watching TV grew steadily to peak at ............. in the 2000s before ..................

8

Fill in the Blanks

media image

Type answer...

9

Fill in the Blanks

media image

Type answer...

10

Fill in the Blanks

media image

Type answer...

11

Categorize

Options (12)

senior citizens

older adults

the aged population

people over 60

engaged in leisure activities

made use of their spare time

devoted their time to recreation

participated in pastimes

in the years 1980 and 2010

between 1980 and 2010

over the three decades from 1980 to 2010

during the period spanning 1980–2010

Organize these options into the right categories

Elderly people
Spent their free time
1980 and 2010

12

Open Ended

Question image

Write the Introduction and the Overview of the graph

13

Open Ended

Question image

Draft an outline for Body 1

14

Open Ended

Question image

Write Body 2

15

Open Ended

Question image

Draft an outline for Body 2

16

Open Ended

Question image

Write Body 1

IELTS WRITING TASK 1 - LINE GRAPH
Elderly people spending free time

By Ánh Ngọc

Show answer

Auto Play

Slide 1 / 16

SLIDE

Discover more resources for English