Search Header Logo
Graphing WaGslides

Graphing WaGslides

Assessment

Presentation

•

Physics

•

9th Grade

•

Practice Problem

•

Hard

•
NGSS
MS-PS3-1, MS-PS2-2, HS-ESS2-1

+2

Standards-aligned

Created by

Michel Skinner

FREE Resource

15 Slides • 14 Questions

1

media

2

media

3

media

4

Multiple Choice

Which type of graph would you use to compare data grouped by categories?

1

Bar graph

2

Pie graph

3

Line graph

4

Scatterplot

5

media

6

Multiple Choice

What activity does this person spend the most time on?

1

Sleep

2

School

3

Studying

4

Other

7

media

8

Multiple Choice

What is the main purpose of a line graph?

1

To show trends in data over time

2

To compare categories

3

To show parts of a whole

4

To display random data points

9

media

10

Open Ended

Explain the difference between an independent variable and a dependent variable in an experiment.

11

media

12

Fill in the Blanks

On which axis is the independent variable found on an XY graph?

13

media

14

media

15

Multiple Choice

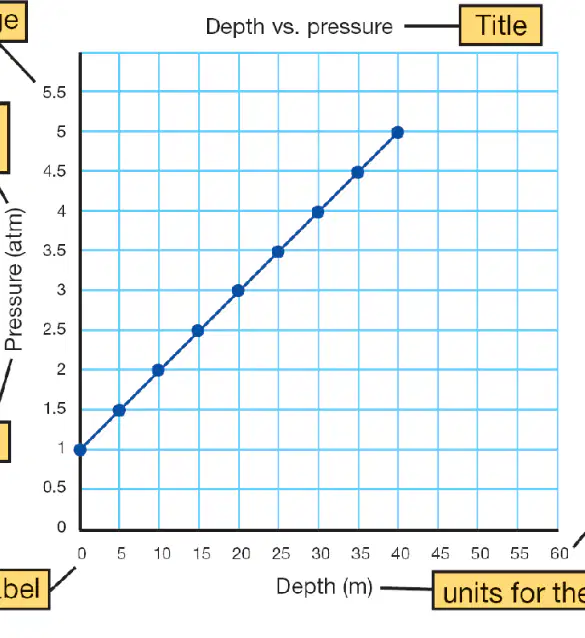
Which type of graph is most appropriate to show the relationship between pressure and depth?

1

XY scatter plot or line graph

2

Bar graph

3

Pie chart

4

Histogram

16

media

17

Labeling

Where does each of these go on a graph?

Drag labels to their correct position on the image

independent variable

dependent variable

18

Fill in the Blanks

Fill in the blank: On an XY graph showing depth and pressure, depth is the

variable.

19

media

20

Dropdown

Question image
Pressure
as you go deeper into the Earth.

21

Multiple Choice
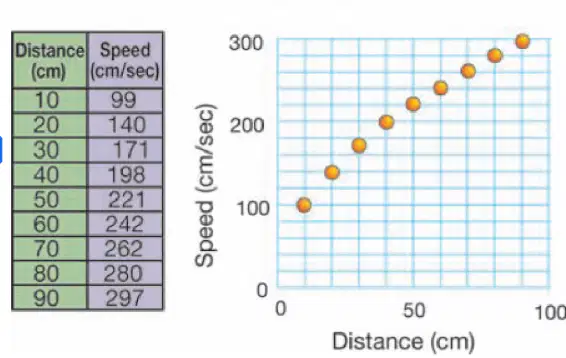
Question image

What is this graph missing?

1

Axes labeled

2

Title

3

x & y value range appropriate for data

4

units

22

Match

Match the following

Line Graph

Bar Graph

Scatter Plot

Pie Graph

23

media

24

media

25

media

26

Open Ended

Explain the difference between a direct relationship and an inverse relationship as shown in the graphs.

27

Match

Match the following

Direct

No relationship

Inverse

28

media

29

Multiple Choice

Question image

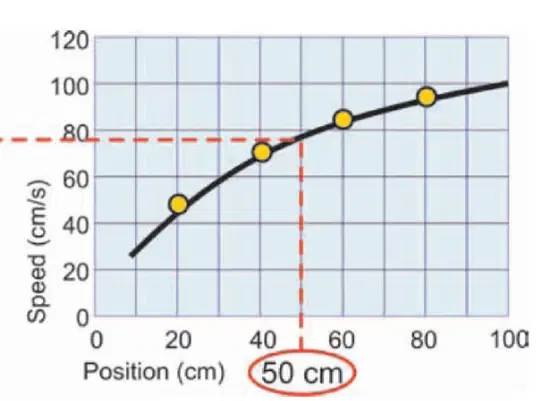
According to the graph, what is the predicted speed at a position of 50 cm?

1

76 cm/s

2

50 cm/s

3

100 cm/s

4

60 cm/s

pattern-tertiary
media

Show answer

Auto Play

Slide 1 / 29

SLIDE