- Resource Library
- Math
- Probability And Statistics
- Line Of Best Fit
- L82 A1 4.5 Scatter Plots & Line Of Best Fit

L82 - A1 - 4.5 - Scatter Plots & Line of Best Fit
Presentation
•
Mathematics
•
9th - 12th Grade
•
Practice Problem
•
Medium
Standards-aligned

Bradley Lewis
Used 6+ times
FREE Resource
25 Slides • 13 Questions
1

2
Dropdown

Parallel:
Perpendicular:
3

4
Multiple Choice

2. Which equation written in point slope form represents the graph?
5

6

7

8
Math Response
9

10
Math Response
11

12
Open Ended
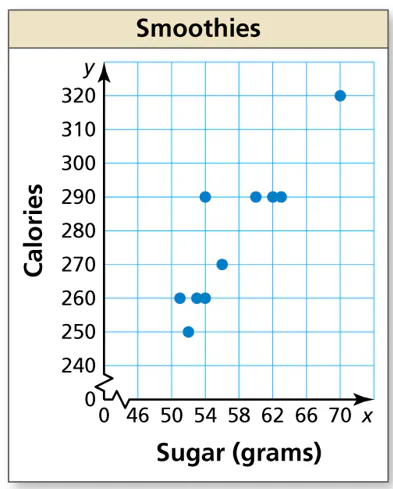
3. What tends to happen to the number of calories as the number of grams of sugar increases?
13

14
Open Ended
4. From the graph, find the number of smoothies for each description. Explain your reasoning.
a. smoothies with at least 270 calories
15

16
Open Ended
4. From the graph, find the number of smoothies for each description. Explain your reasoning.
b. smoothies with less than 50 grams of sugar
17

18
Open Ended
4. From the graph, find the number of smoothies for each description. Explain your reasoning.
c. smoothies with more than 275 calories and less than 62 grams of sugar
19

20

21

22

23

24

25
Open Ended
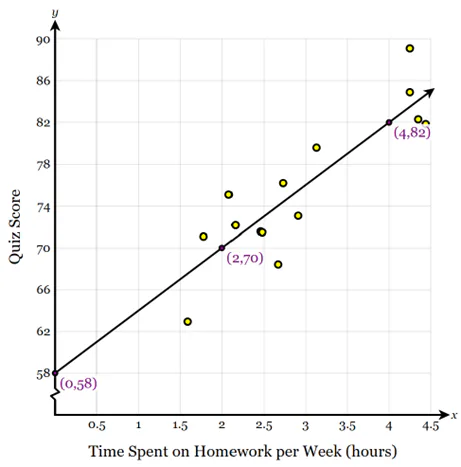
1. What is the meaning of the x-value on the line when y = 58?
26

27
Open Ended
2. What is the meaning of the y-value on the line when x = 4?
28

29
Open Ended
3. What does the point (2,70) represent?
30

31
Open Ended
4. What does the slope of the line represent?
32

33

34

35

36
Math Response
37

38
Show answer
Auto Play
Slide 1 / 38
SLIDE
