Search Header Logo
Lesson 29 Scatter Plots

Lesson 29 Scatter Plots

Assessment

Presentation

•

Mathematics

•

8th Grade

•

Medium

•
CCSS
8.SP.A.1, 8.SP.A.2

Standards-aligned

Created by

Katie Sides

Used 5+ times

FREE Resource

8 Slides • 12 Questions

1
media

2

media

3

media

4

media

5

media

6

Multiple Choice

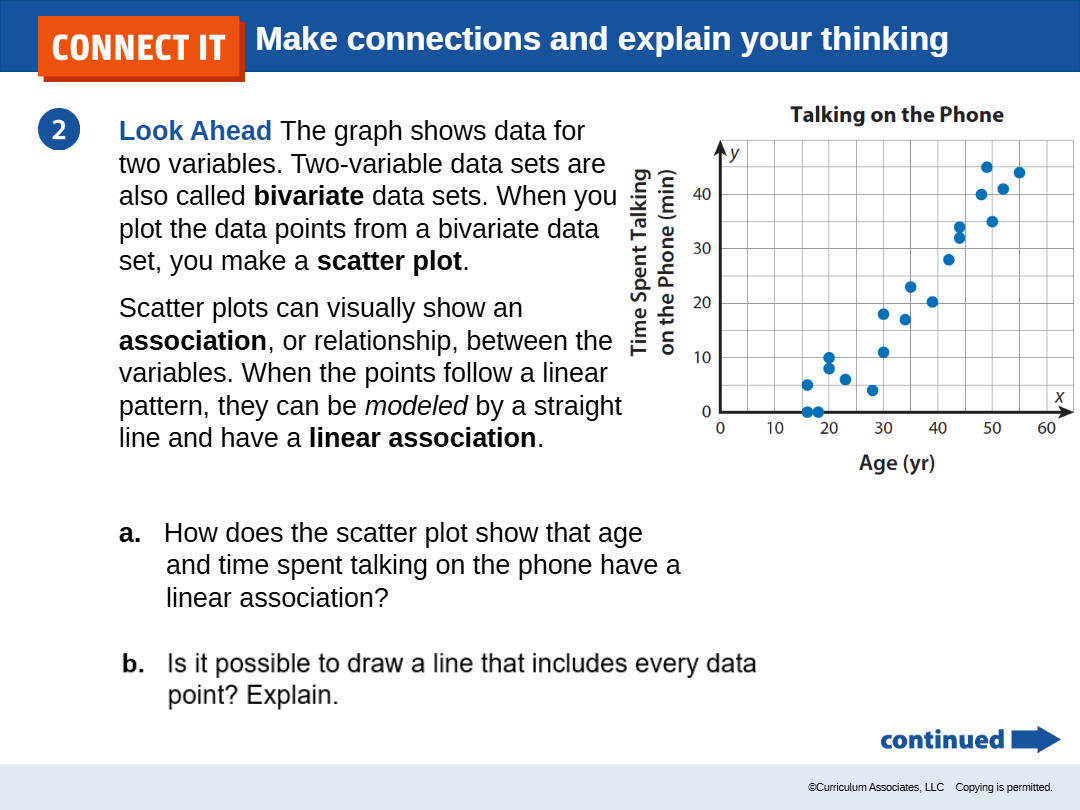
Which of the following best describes a linear association in a scatter plot?

1

The points form a straight line pattern.

2

The points are scattered randomly.

3

The points form a circular pattern.

4

The points all overlap at one spot.

7

Multiple Choice

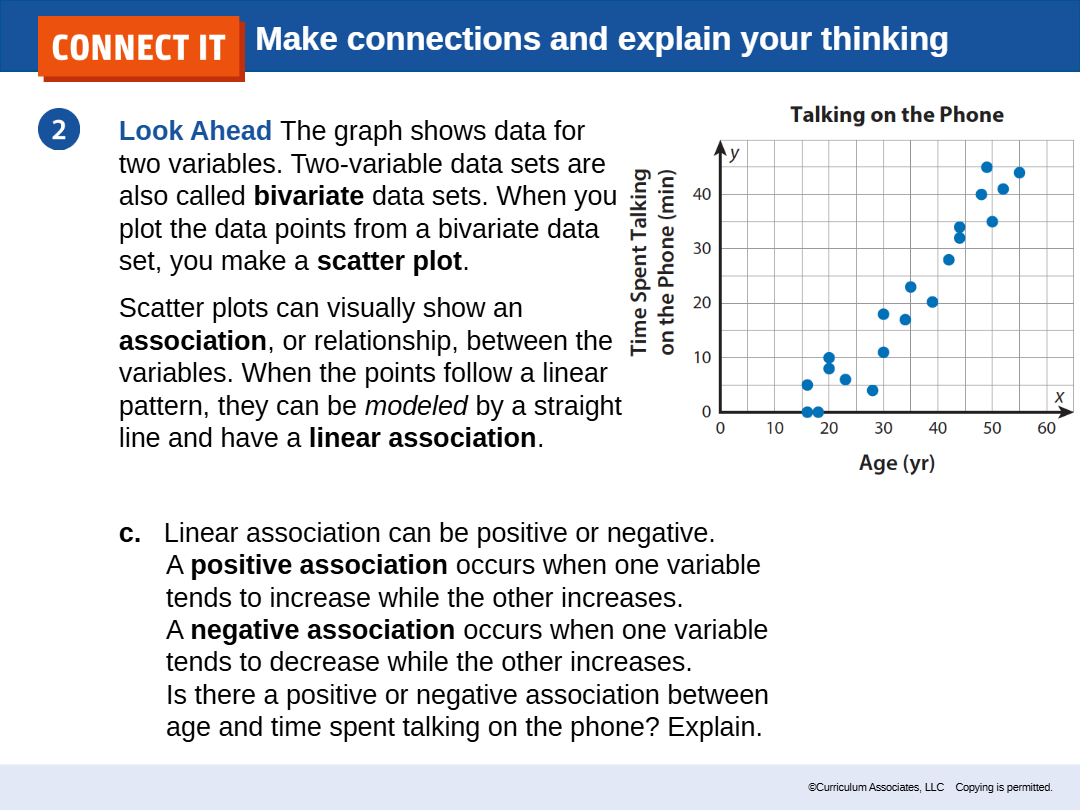
Is there a positive or negative association between age and time spent talking on the phone? Explain.

1

Positive

2

Negative

8

Multiple Choice

Question image

Which scatter plot shows no association?

1

Anime Festival

2

Anime Collectibles

9

Multiple Choice

Question image

Which scatter plot appears to be more linear?

1

Scatter plot A,

2

Scatter plot B

10

Multiple Choice

Question image

Does the scatter plot show a linear association, a nonlinear association, or no association between the variables? Explain.

1

Linear

2

Nonlinear

3

No Association

11

media

12

Multiple Choice

Question image

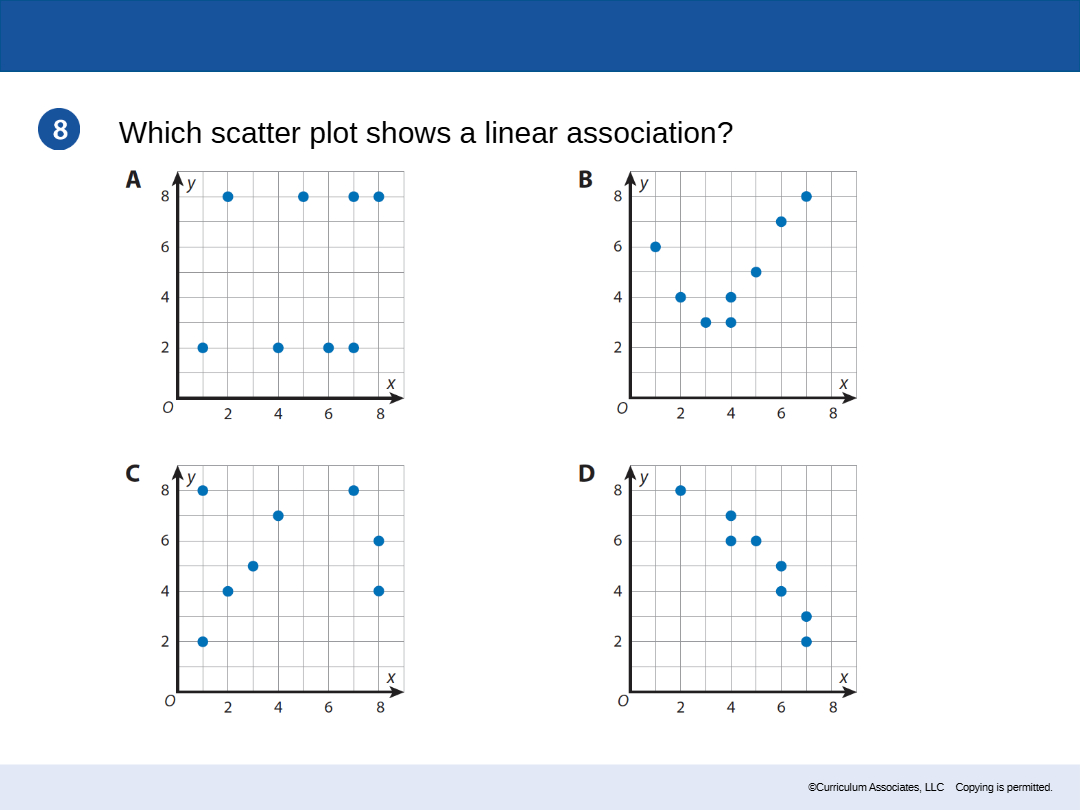
Which scatter plot shows a linear association?

1

A

2

B

3

C

4

D

13

media

14

Multiple Choice

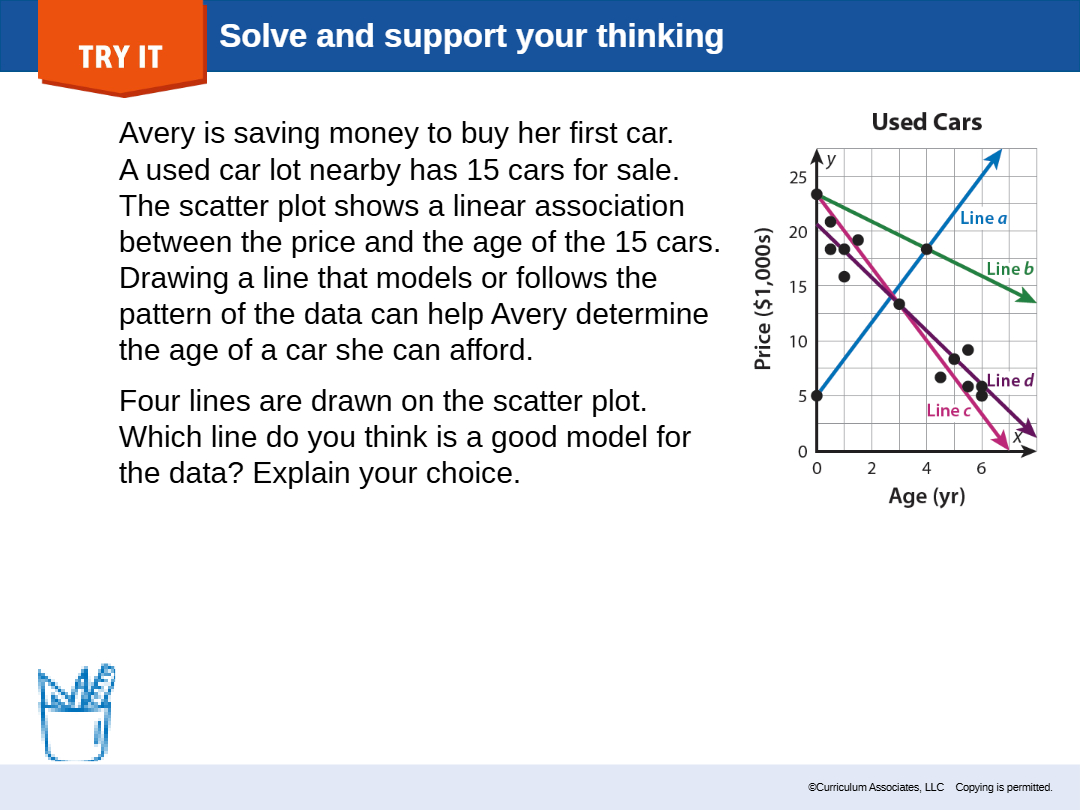
Which line do you think is a good model for the data in the used car scatter plot? Explain your choice.

1

A

2

B

3

C

4

D

15

media

16

Multiple Select

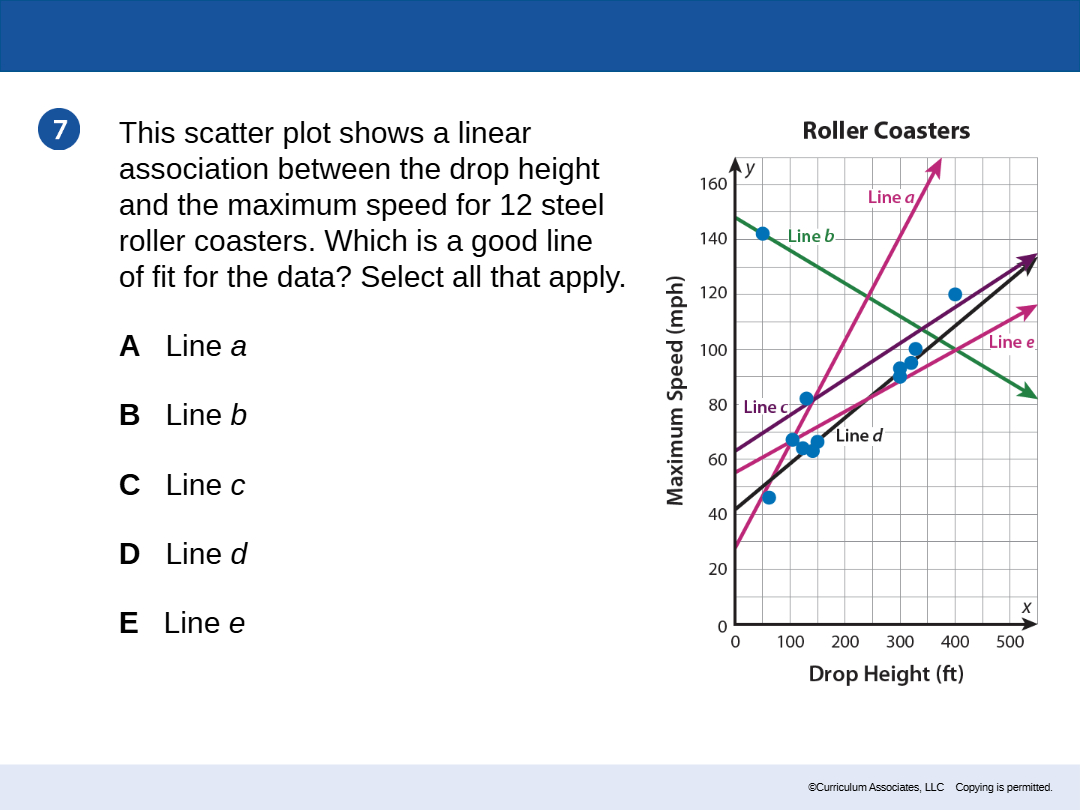
This scatter plot shows a linear association between the drop height and the maximum speed for 12 steel roller coasters. Which is a good line of fit for the data? Select all that apply.

1

Line a

2

Line b

3

Line c

4

Line d

5

Line e

17

Multiple Choice

Question image

Identify the line of best fit.

1

A

2

B

3

C

4

D

18

Multiple Select

Question image

Identify the line of best fit and whether it is a positive or negative association.

1

Positive

2

B

3

C

4

D

5

Negative

19

Multiple Select

Question image

Identify the line of best fit and whether it is a positive or negative association.

1

Negative

2

B

3

C

4

D

5

Positive

20

Multiple Choice

Question image

Exit Ticket:

Which of the following lines represents the line of best fit for the scatter plot?

1
A
2
B
3
C
4
D
pattern-tertiary
media

Show answer

Auto Play

Slide 1 / 20

SLIDE