CH. 2 Tools of Science
Authored by Lindsey Andreski
Science
6th Grade
CCSS covered
Used 2+ times

AI Actions
Add similar questions
Adjust reading levels
Convert to real-world scenario
Translate activity
More...
Content View
Student View
38 questions
Show all answers
1.
MULTIPLE CHOICE QUESTION
30 sec • 1 pt

The number that appears most often in a set of data.
Mean
Median
Mode
Answer
Tags
CCSS.6.SP.A.3
2.
MULTIPLE CHOICE QUESTION
30 sec • 1 pt

The numerical average of a set of data.
Mean
Median
Mode
Answer
3.
MULTIPLE CHOICE QUESTION
30 sec • 1 pt

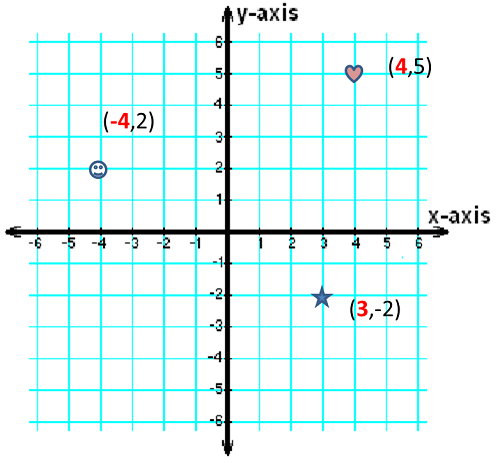
A point on a graph showing the location of a piece of data.
Origin
Data Point
Best Fit Line
Coordinates
4.
MULTIPLE CHOICE QUESTION
30 sec • 1 pt
A line graph in which the data points create a straight line.
Linear Graph
Nonlinear Graph
No Trend Graph
Scatter Plot
5.
MULTIPLE CHOICE QUESTION
30 sec • 1 pt

The middle number in a set of data.
mean
median
mode
answer
6.
MULTIPLE CHOICE QUESTION
30 sec • 1 pt

A line graph in which the data points DO NOT fall on a straight line.
Linear Graph
Nonlinear Graph
Bar Graph
Circle Graph
7.
MULTIPLE CHOICE QUESTION
30 sec • 1 pt

Refers to how close a group of measurements are to each other.
Accuracy
Precision
Mean
Median


Access all questions and much more by creating a free account
Create resources
Host any resource
Get auto-graded reports
Continue with Google

Continue with Email
Continue with Classlink
Continue with Clever
or continue with
Microsoft
%20(1).png)
Apple
Others
Already have an account?
