
Speed and Velocity
6th - 8th Grade
•38 Qs

Similar activities
Distance-Time Graphs and Speed
6th Grade
•40 Qs
Distance vs Time Graphs
6th Grade
•37 Qs
Shackford SBA #2 Review - On Level
6th Grade
•34 Qs
Chapter 1: Describing Motion
8th Grade
•35 Qs
Unit 5: Forces & Motion Study Guide Review
6th - 10th Grade
•36 Qs
Motion Graphs and Net Force
8th Grade
•42 Qs
Forces and Motion Review
6th - 7th Grade
•38 Qs
8th Midterm 22-23
8th Grade
•40 Qs

Speed and Velocity
Quiz
•
Science
•
6th - 8th Grade
•
Medium
+1
Standards-aligned

lannette.fraser@birdvilleschools.net lannette.fraser@birdvilleschools.net
Used 374+ times
FREE Resource
38 questions
Show all answers
1.
MULTIPLE CHOICE QUESTION
2 mins • 1 pt
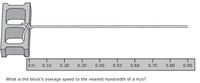
A block pulled 0.70 m to the right 0.14 s. What is the Average speed?
5
0.098
.74
1.4
2.
MULTIPLE CHOICE QUESTION
30 sec • 1 pt
A bus travels 40 km in 10 minutes. What is the average speed of the bus in km/hour.
410 km/h
400 km/h
240 km/h
50 km/h
3.
MULTIPLE CHOICE QUESTION
1 min • 1 pt
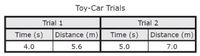
What was the average speed of the toy car during the two trials to the nearest tenth of a m/s?
1.4 m/s
0.7
14
113.4
Tags
NGSS.MS-PS3-1
4.
MULTIPLE CHOICE QUESTION
2 mins • 1 pt

Which of these accurately describes the motion of the toy train?
The toy train speeds up while going forward and then slows down
The toy train slows down while going forward and the moves backwards.
The toy train moves forward at a constant speed , slows down, and then stops.
The toy train moves forward at in increasing speed, stops, and then moves forward.
Tags
NGSS.MS-PS3-1
5.
MULTIPLE CHOICE QUESTION
1 min • 1 pt
Four students ran two times around a running path at a local park. Which graph best represents a stop for 10 minutes the student's motion?


Tags
NGSS.MS-PS3-1
6.
MULTIPLE CHOICE QUESTION
30 sec • 1 pt
Which graph displays the motion of car as it decreasing speed?


Tags
NGSS.MS-PS3-1
7.
MULTIPLE CHOICE QUESTION
30 sec • 1 pt
1. Which two measurements are needed in order to calculate the speed of an object in motion?
Time and Distance
Volume and Mass
Distance and Force
Mass and Milliliters
Tags
NGSS.MS-PS3-1


Create a free account and access millions of resources
Similar Resources on Wayground
35 questions
Forces and Energy (Year 8)
Quiz
•
8th Grade
41 questions
Nature of Science
Quiz
•
7th - 8th Grade
40 questions
Unit 3 Test Review - Motion
Quiz
•
7th Grade
36 questions
Speed, Velocity, Acceleration
Quiz
•
8th Grade
33 questions
Word Problems - Module 2
Quiz
•
8th Grade
43 questions
Chapter 1 - Describing Motion
Quiz
•
6th - 8th Grade
42 questions
Unit Motion Review Game
Quiz
•
6th - 8th Grade
38 questions
Cumulative Review: Science 8
Quiz
•
8th Grade
Popular Resources on Wayground
10 questions
Lab Safety Procedures and Guidelines
Interactive video
•
6th - 10th Grade
10 questions
Nouns, nouns, nouns
Quiz
•
3rd Grade
10 questions
9/11 Experience and Reflections
Interactive video
•
10th - 12th Grade
25 questions
Multiplication Facts
Quiz
•
5th Grade
11 questions
All about me
Quiz
•
Professional Development
22 questions
Adding Integers
Quiz
•
6th Grade
15 questions
Subtracting Integers
Quiz
•
7th Grade
9 questions
Tips & Tricks
Lesson
•
6th - 8th Grade
Discover more resources for Science
20 questions
Scientific method and variables
Quiz
•
8th Grade
20 questions
Chemical and Physical Changes
Quiz
•
7th Grade
20 questions
Physical and Chemical Changes
Quiz
•
8th Grade
10 questions
Scientific Method and Variables
Quiz
•
6th Grade
20 questions
Elements, Compounds and Mixtures
Quiz
•
8th Grade
23 questions
7.6C Aqueous Solutions
Quiz
•
7th Grade
20 questions
Law of Conservation of Mass
Quiz
•
6th - 8th Grade
20 questions
Metals, Non-metals, and Metalloids
Quiz
•
6th Grade