Graphical Representations of Data (No box & whiskers)
Quiz
•
Mathematics
•
11th - 12th Grade
•
Practice Problem
•
Medium
+17
Standards-aligned
Brian McCleskey
Used 14+ times
FREE Resource
Enhance your content in a minute
43 questions
Show all answers
1.
MULTIPLE CHOICE QUESTION
1 min • 1 pt

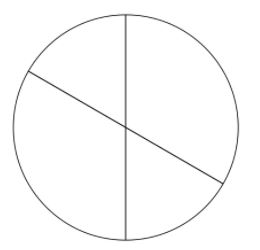
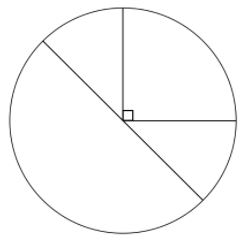
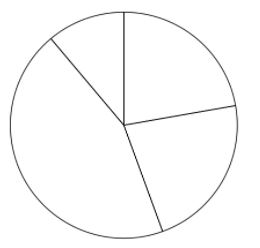
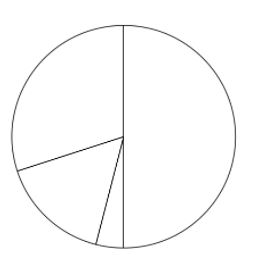
Which pie chart represents the same data as the table?


2.
MULTIPLE CHOICE QUESTION
2 mins • 1 pt

There are 200 vegetable plants in a garden. How many of the vegetable plants are green beans?
16
24
28
32
Tags
CCSS.5.NF.B.3
3.
MULTIPLE CHOICE QUESTION
2 mins • 1 pt

200 people were surveyed about their favourite ice cream. How many chose Kesar Pista?
Tags
CCSS.7.RP.A.3
4.
MULTIPLE CHOICE QUESTION
5 mins • 1 pt

600 people were surveyed. How many people rode the stationary bikes that day?
150 people
120 people
90 people
None of these
Tags
CCSS.4.NF.B.4B
CCSS.4.NF.B.4C
5.
MULTIPLE CHOICE QUESTION
2 mins • 1 pt

According to this graph, what is the most popular flavor of Jolly Rancher?
Tags
CCSS.2.MD.D.9
6.
MULTIPLE CHOICE QUESTION
2 mins • 1 pt
What percentage does a whole circle graph represent?
Tags
CCSS.7.RP.A.3
7.
MULTIPLE CHOICE QUESTION
5 mins • 1 pt

Each dot represents 1 day. How many days were recorded?
9
21
20
105
Access all questions and much more by creating a free account
Create resources
Host any resource
Get auto-graded reports

Continue with Google

Continue with Email

Continue with Classlink

Continue with Clever
or continue with

Microsoft
%20(1).png)
Apple
Others
Already have an account?
Similar Resources on Wayground

42 questions
Complex Numbers. Matrices, & Vectors Review
Quiz
•
10th - 12th Grade

46 questions
CompTIA ITFundamentals CRAM
Quiz
•
6th Grade - University

40 questions
Ch.2 Reasoning and Proofs
Quiz
•
9th - 12th Grade

38 questions
Exponential Growth vs. Decay Quiz
Quiz
•
9th Grade - University

40 questions
Logarithm Practice
Quiz
•
12th Grade - University

40 questions
Algebra 2: Semester 2 Final Exam Review
Quiz
•
10th - 11th Grade

39 questions
AP Calc - IVT, EVT, MVT
Quiz
•
10th - 12th Grade

40 questions
Matematika
Quiz
•
12th Grade
Popular Resources on Wayground

5 questions
This is not a...winter edition (Drawing game)
Quiz
•
1st - 5th Grade

25 questions
Multiplication Facts
Quiz
•
5th Grade

10 questions
Identify Iconic Christmas Movie Scenes
Interactive video
•
6th - 10th Grade

20 questions
Christmas Trivia
Quiz
•
6th - 8th Grade

18 questions
Kids Christmas Trivia
Quiz
•
KG - 5th Grade

11 questions
How well do you know your Christmas Characters?
Lesson
•
3rd Grade

14 questions
Christmas Trivia
Quiz
•
5th Grade

20 questions
How the Grinch Stole Christmas
Quiz
•
5th Grade
Discover more resources for Mathematics

20 questions
Christmas Lyrics
Quiz
•
12th Grade

15 questions
Mock Fall Final
Quiz
•
9th - 12th Grade

23 questions
Rational Exponents and Simplifying using Exponent Properties
Quiz
•
9th - 12th Grade

12 questions
Polynomials 7-1/7-2/7-3
Lesson
•
9th - 12th Grade

13 questions
Congruent Triangle Proofs
Quiz
•
9th - 12th Grade

14 questions
Permutations and Combinations
Quiz
•
9th - 12th Grade

13 questions
Reading And Writing Numerical Expression
Quiz
•
6th - 12th Grade

11 questions
73 WarmUp: Graphing SOE/Ineqs
Quiz
•
9th - 12th Grade


