
Unit Rate Graphs
8th Grade
•11 Qs

Similar activities
MATES
1st - 10th Grade
•15 Qs
KUIZ MATEMATIK
1st - 10th Grade
•10 Qs
Mathematic Revision
6th - 9th Grade
•12 Qs
Form 2 Revision
8th - 9th Grade
•13 Qs
Quiz Relasi dan Fungsi
8th Grade
•10 Qs
Percents and Interest Review
6th - 8th Grade
•10 Qs
F2 C8 GRAPH OF FUNCTION
8th Grade
•10 Qs
F2 Chapter 9 Speed
1st - 12th Grade
•10 Qs

Unit Rate Graphs
Quiz
•
Mathematics
•
8th Grade
•
Practice Problem
•
Medium
Standards-aligned

Sulema Meyers
Used 790+ times
FREE Resource
Enhance your content in a minute
11 questions
Show all answers
1.
MULTIPLE CHOICE QUESTION
5 mins • 1 pt

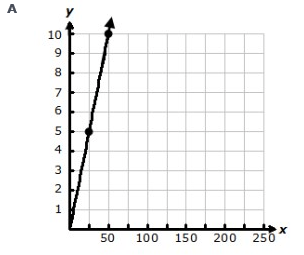
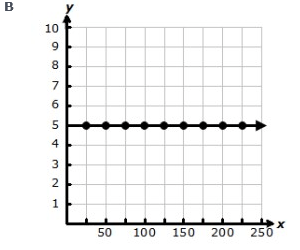
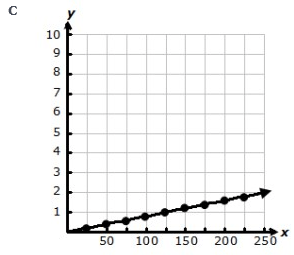
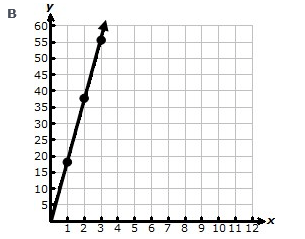
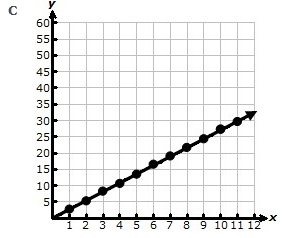
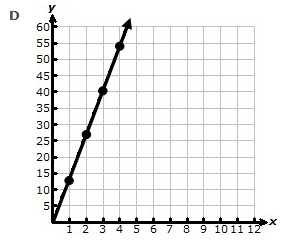
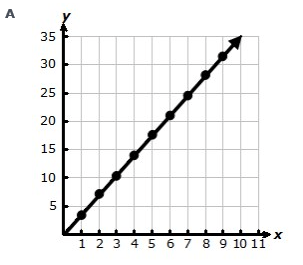
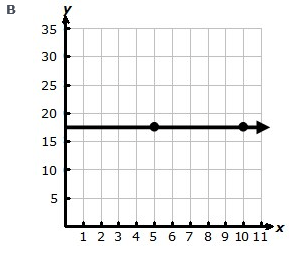
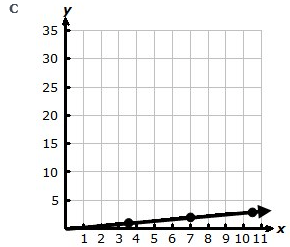
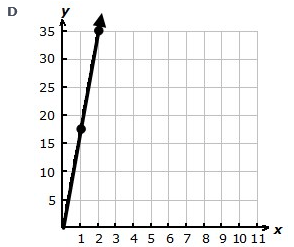
Which graph represents the data?


Tags
CCSS.7.RP.A.2D
2.
MULTIPLE CHOICE QUESTION
5 mins • 1 pt

Which graph represents the data and shows the unit rate?


Tags
CCSS.7.RP.A.2D
3.
MULTIPLE CHOICE QUESTION
5 mins • 1 pt

Which statement is the correct unit rate?
5 seconds per foot
5 feet per second
2.5 seconds per foot
2.5 feet per second
Tags
CCSS.7.RP.A.2D
4.
MULTIPLE CHOICE QUESTION
5 mins • 1 pt
For every 125 pages Daysha reads, she earns 5 points. Which graph models this relationship?

Tags
CCSS.7.RP.A.2D
5.
MULTIPLE CHOICE QUESTION
5 mins • 1 pt

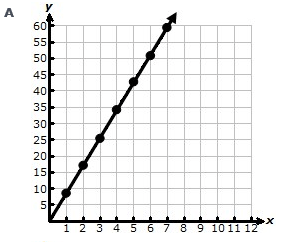
Based on the graph, explain the unit rate.
The unit rate is
The unit rate is 125
The unit rate is 1
Not here
Tags
CCSS.7.RP.A.2D
6.
MULTIPLE CHOICE QUESTION
5 mins • 1 pt
Carter receives $13.50 for every 5 boxes of chocolate he sells. Which graph shows this relationship?
Tags
CCSS.7.RP.A.2D
7.
MULTIPLE CHOICE QUESTION
5 mins • 1 pt

Which graph shows the same unit rate?


Tags
CCSS.7.RP.A.2D


Access all questions and much more by creating a free account
Create resources
Host any resource
Get auto-graded reports
Continue with Google

Continue with Email
Continue with Classlink
Continue with Clever
or continue with
Microsoft
%20(1).png)
Apple
Others
Already have an account?
Similar Resources on Wayground
15 questions
TBA 3 Review
Quiz
•
7th - 8th Grade
12 questions
Formules met haakjes, kwadraten en wortels 2kgt2
Quiz
•
1st - 10th Grade
14 questions
circumferència i cercle
Quiz
•
1st - 12th Grade
15 questions
Educazione Civica: Produzione e consumo di energia
Quiz
•
8th - 12th Grade
15 questions
Financial Mathematics Review Test
Quiz
•
8th - 10th Grade
15 questions
8th Grade Math Assessment I
Quiz
•
8th Grade
12 questions
PLCE VALUE IN INDIAN SYSTEM
Quiz
•
6th - 8th Grade
12 questions
Scatter Plots and Two-Way Tables
Quiz
•
8th Grade
Popular Resources on Wayground
15 questions
Fractions on a Number Line
Quiz
•
3rd Grade
20 questions
Equivalent Fractions
Quiz
•
3rd Grade
25 questions
Multiplication Facts
Quiz
•
5th Grade
22 questions
fractions
Quiz
•
3rd Grade
20 questions
Main Idea and Details
Quiz
•
5th Grade
20 questions
Context Clues
Quiz
•
6th Grade
15 questions
Equivalent Fractions
Quiz
•
4th Grade
20 questions
Figurative Language Review
Quiz
•
6th Grade
Discover more resources for Mathematics
15 questions
Product of Powers Property A1 U7
Quiz
•
8th Grade
20 questions
Laws of Exponents
Quiz
•
8th Grade
16 questions
8th U5L5 Graphs of Functions
Quiz
•
8th Grade
20 questions
Graphing Inequalities on a Number Line
Quiz
•
6th - 9th Grade
20 questions
Exponent Rules Review
Quiz
•
8th - 9th Grade
20 questions
One Step equations addition and subtraction
Quiz
•
5th - 8th Grade
20 questions
Translations
Quiz
•
8th Grade
25 questions
Complementary and Supplementary Angles
Quiz
•
7th - 10th Grade