Features of Functions + Function Algebra
Authored by Brandon Baldomero
Mathematics
9th Grade
CCSS covered
Used 670+ times

AI Actions
Add similar questions
Adjust reading levels
Convert to real-world scenario
Translate activity
More...
Content View
Student View
15 questions
Show all answers
1.
MULTIPLE CHOICE QUESTION
15 mins • 1 pt

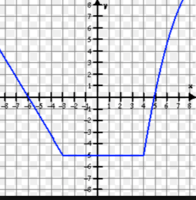
What is the y-intercept?
Tags
CCSS.HSF.IF.B.4
CCSS.HSA.CED.A.2
CCSS.HSA.REI.D.10
CCSS.HSF.IF.C.7
CCSS.HSS.ID.C.7
2.
MULTIPLE CHOICE QUESTION
15 mins • 1 pt

What is the minimum of this graph?
Tags
CCSS.HSF-IF.C.7A
3.
MULTIPLE CHOICE QUESTION
15 mins • 1 pt

What is the maximum height?
200
50
3
0
Tags
CCSS.HSA.CED.A.2
CCSS.HSA.REI.B.4
CCSS.HSA.REI.D.10
CCSS.HSA.SSE.A.1
CCSS.HSA.CED.A.1
4.
MULTIPLE CHOICE QUESTION
15 mins • 1 pt
When is the maximum height reached?
200
50
3
0
Tags
CCSS.HSA.REI.B.4
CCSS.HSA.SSE.A.1
5.
MULTIPLE CHOICE QUESTION
15 mins • 1 pt

What is the minimum?
Tags
CCSS.HSF-IF.C.7A
6.
MULTIPLE CHOICE QUESTION
15 mins • 1 pt

What is the domain of the graph?
from x = 1 to x = 4
from x = 2 to x = 6
from y = 1 to y = 4
from y = 2 to y = 6
Tags
CCSS.8.F.A.1
CCSS.HSF.IF.B.5
7.
MULTIPLE CHOICE QUESTION
15 mins • 1 pt
What is the range of the graph?
from x = 1 to x = 4
from x = 2 to x = 6
from y = 1 to y = 4
from y = 2 to y = 6
Tags
CCSS.8.F.A.1
CCSS.HSF.IF.B.5


Access all questions and much more by creating a free account
Create resources
Host any resource
Get auto-graded reports
Continue with Google

Continue with Email
Continue with Classlink
Continue with Clever
or continue with
Microsoft
%20(1).png)
Apple
Others
Already have an account?
